Lately, the low volatility regime has been testing the coping mechanisms of volatility traders. With few exceptions outside the equity space - like our recent DBA trade - those leaning on the sell side have struggled to deal with the lack of wind. Putting on a straddle feels increasingly like sitting on a ticking bomb: is this the moment when things go horribly wrong?
This sentiment is further intensified by the dire warnings of tail risk fund managers, who, like modern-day Cassandras, foretell doom for whoever wants to listen.
Repent, you foolish Vol sellers; the asteroid Volmagedon is about to obliterate your accounts.
You should pay close attention to these warnings, of course. But as any seasoned sailor knows, predicting when the winds will pick up is a fool’s errand.
In the meantime, life and trading go on; whether it's for livelihood or the thrill, we must navigate these seemingly endless calm seas and make the most out of them.
So what's the plan?
You can join the circus of doomsayers on Twitter’s deck, hoping to somehow sway the market gods. Or, you can imitate the seasoned sailors: take the oars in your own hand and keep rowing.
The choice is always yours.

The lower the VIX, the higher the VRP.
As we anticipated, the chart indeed confirms that over the past 20 years, protection prices have been disproportionately high compared to actual market risks, particularly when the VIX is at its lowest readings.
But what about our hunch regarding the relative expense of short-term risk insurance? To dive deeper into this, we now introduce a VRP measure using VIX9D - the VIX calculated over a 9-day period instead of the traditional 30 days.
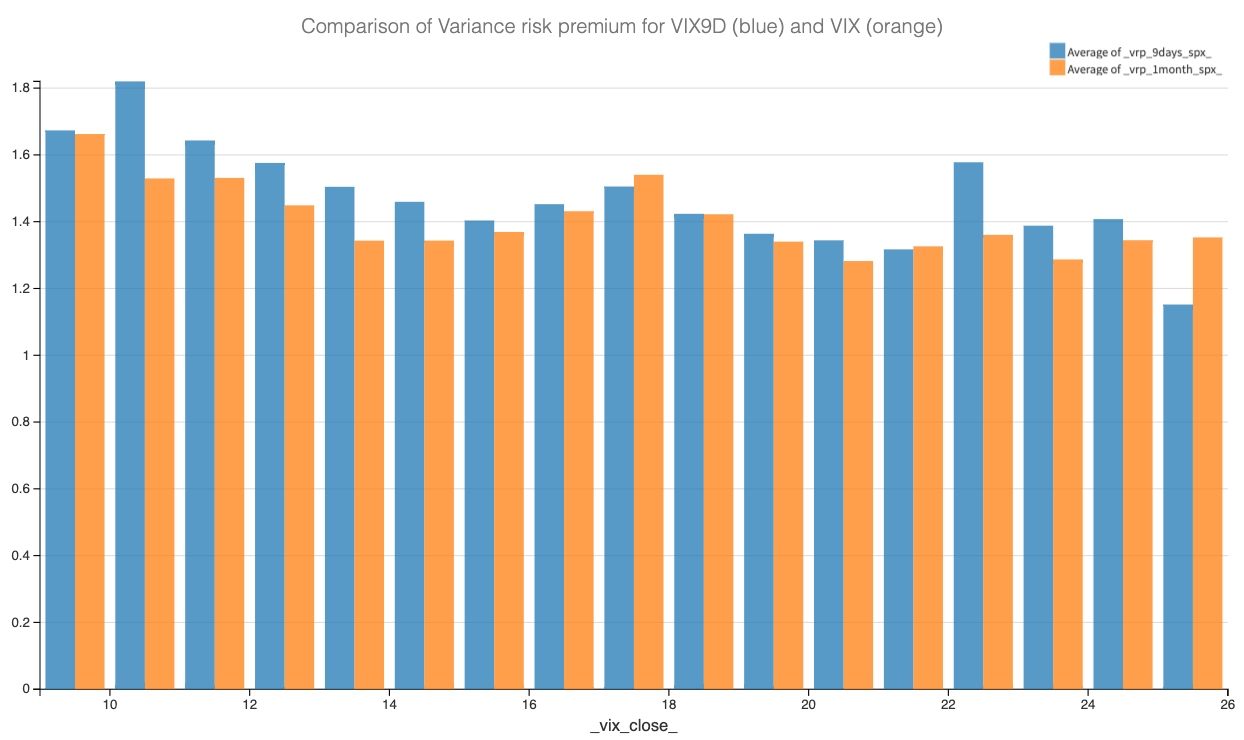
The results affirm our belief: the VRP for the 9-day VIX reading is consistently higher than that for the 30-day VIX in the lower readings. It is more evenly distributed when the VIX is back to normal, between 16 and 22.
At that stage, it is legitimate to wonder if this is a phenomenon unique to the equity market or if it holds true across other asset classes. To explore this, we’ve computed a VIX-like index (using the CBOE formula) for several assets, including VXX, SPY, QQQ, GLD, and TLT. We then compared their variance risk premiums against the VIX measures.
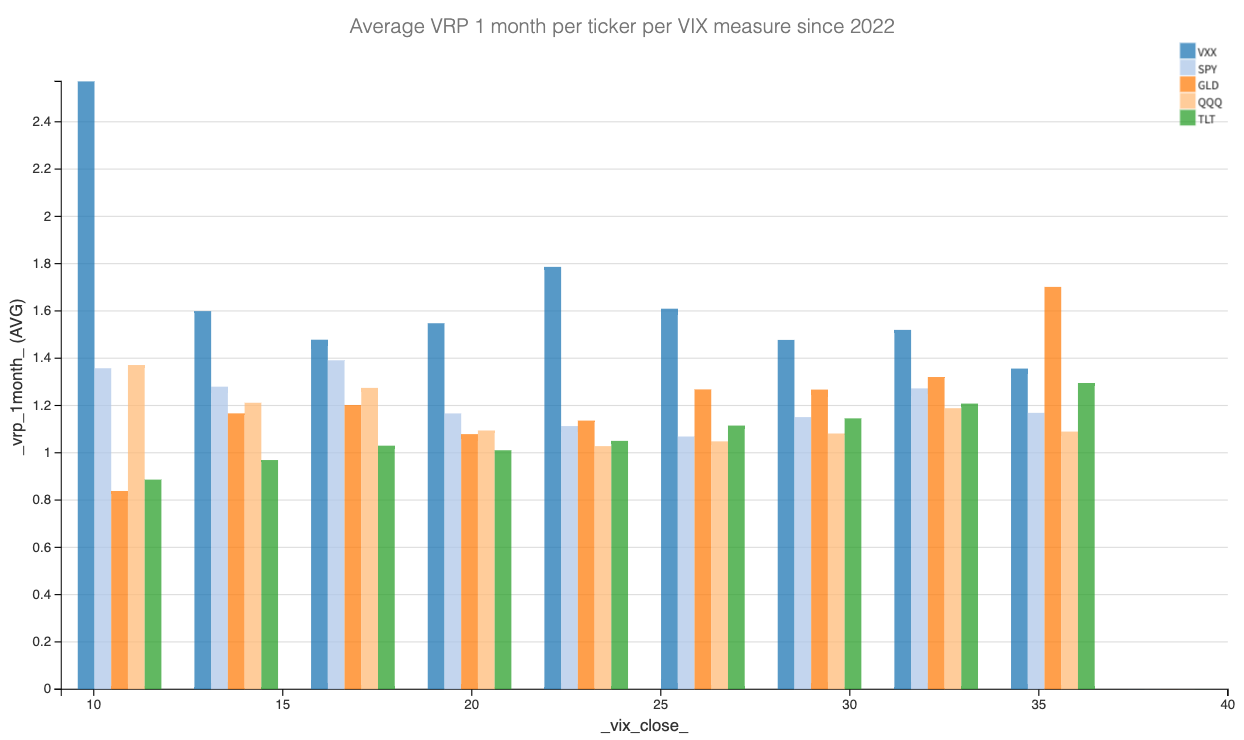
Our initial analysis shows that for SPY and QQQ, this effect is slightly less pronounced but still evident over our two-year data set. Interestingly, the reverse seems to hold true for TLT and GLD.
But the standout observation is VXX. In this low volatility environment, its VRP is exceptionally high. This insight is particularly valuable for option sellers in the current low volatility regime.
Exploring a Sharpe 2+ opportunity in VXX
We can already hear the reservations about shorting volatility in VXX. VXX is an ETN giving exposure to the VIX. It became famous overnight in 2018 when the all-volatility complex blew up because of poorly managed ETNs … like VXX. This incident is referred to as Volmagedon.
Since then, the assets under management in the vol ETN complex have dried out, and it’s perceived as dangerous, with fears of what might happen if the market turns. But they haven’t disappeared, and some people still need some insurance for their positions in VXX and other related VIX-based ETNs.
That is the main reason why we think the VRP is so pronounced compared to other asset classes.
Providing liquidity when nobody wants to do it is exactly why you’re being handsomely compensated. Sure, we’d all prefer to sell a cozy SPY straddle, but that’s what everyone is doing. And as a result, by the law of supply and demand, it’s priced just right.
In contrast, fund managers get jittery at the thought of the VIX spiking in an otherwise calm market. They're willing to pay a hefty premium for that extra layer of protection. This fear can be extremely profitable for those of us ready to take on the risk.
A word of caution: we're not advocating for always engaging in short volatility strategies with VXX. What we are suggesting is that in a low-volatility environment, there seems to be a substantial profit opportunity exacerbated by the fear of a new Volmagedon.
Another word of caution: when considering this trade, your sizing is the best way to protect yourself and control your risks. Things will blow up eventually; therefore, invest wisely. Or, to put it bluntly: do not yolo in these trades, you degens.
VXX is well-known for drifting to zero because of its inherent construction around the contango effect in the VIX futures. This is an advantage in our case as we don't typically engage in delta hedging - that drift must, therefore, already be accounted for by options sellers.
With that in mind, let's dive into the data and see how to implement a trade.
The trade methodology
The next chart will illustrate the distribution of average returns by business days to expiration (BDTE) - we’ve removed weekends and holidays.
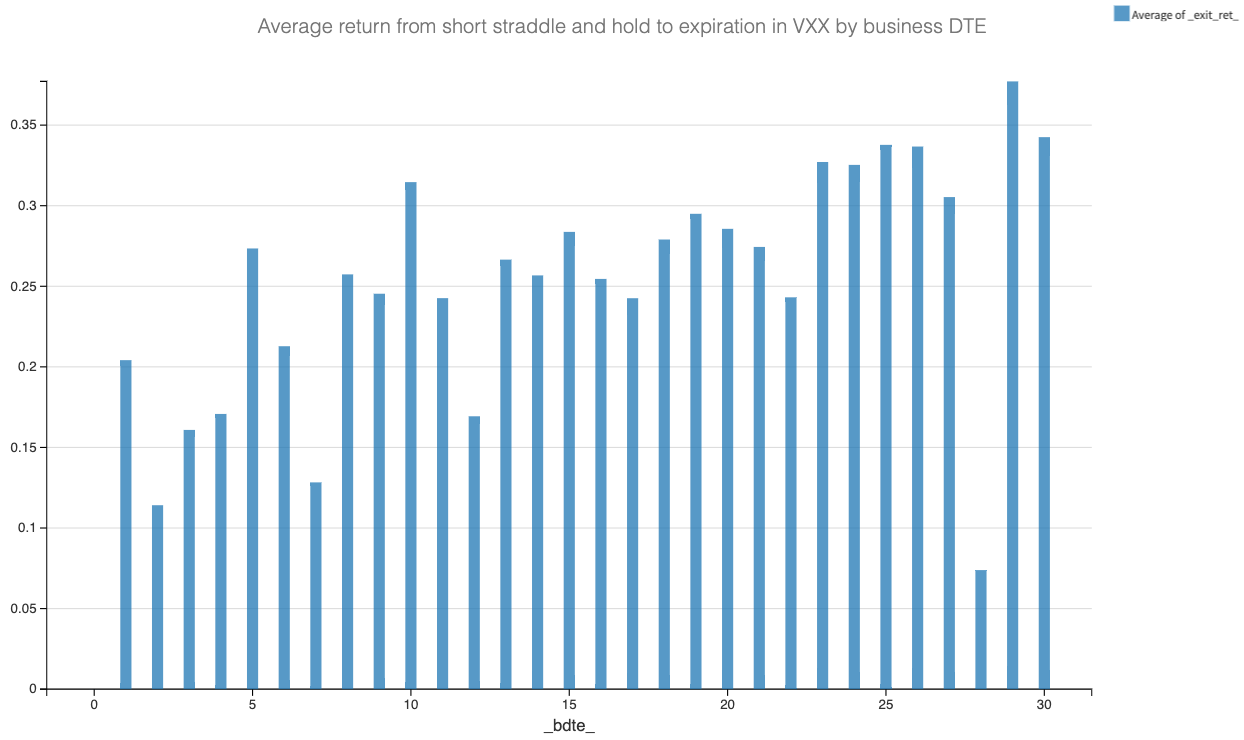
We observed some notable anomalies at 1, 5, and 10 business days to expiration (BDTE).
Interestingly, the average profit from holding a straddle to expiration is almost the same at 10 BDTE as it is above 25 BDTE. Moreover, holding a straddle for 5 BDTE yields nearly the same average return as holding it for 10 BDTE. Most surprisingly, the 1 BDTE straddles show a significant profit potential.
This pattern aligns with the underlying market dynamics.
Large option buyers tend to operate on a schedule. They're unlikely to purchase substantial protection randomly, say 17 days before expiration. Instead, their buying patterns are more predictable – two weeks before, one week before, or even just the day before an event. This schedule is not just about convenience but also about strategic risk management.
Notably, the 5 BDTE translates to one week to expiration and 10 BDTE to two weeks to expiration.
Now, let's examine the performances more closely. For this analysis, we'll assume $1 of credit for each trade to construct these cumulative return charts.
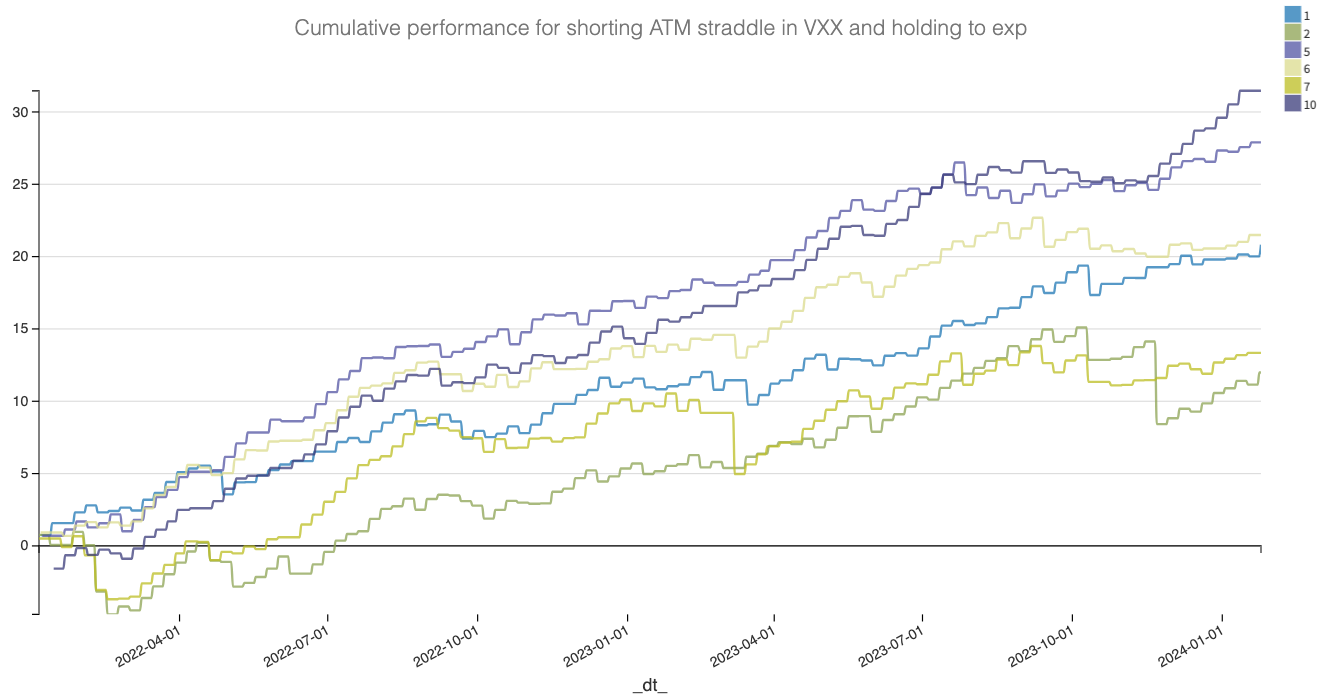
It's truly fascinating to see how the 5 BDTE (which translates to 7 DTE) and 10 BDTE (or 14 DTE) options consistently outperform, even in times when other DTE ranges are stagnant or unprofitable. The same remarkable trend applies to the 1DTE positions. This was particularly evident in the market dynamics of Q3 2022 and the latter half of 2023. These periods perfectly illustrate how large market flows, which are not sensitive to price, can cause significant distortions and create remarkable opportunities.
Now, let's talk about how to implement these insights into a trade methodology. Since VXX only offers only weekly contracts expiring every Friday, here’s our approach:
- Just before the market closes on Fridays, initiate either a 7 DTE or a 14 DTE at-the-money straddle in VXX and hold it until expiration.
- Similarly, right before the close on Thursdays, enter a 1 DTE at-the-money straddle in VXX and hold it until expiration.
A quick glance at some performance metrics from last year.
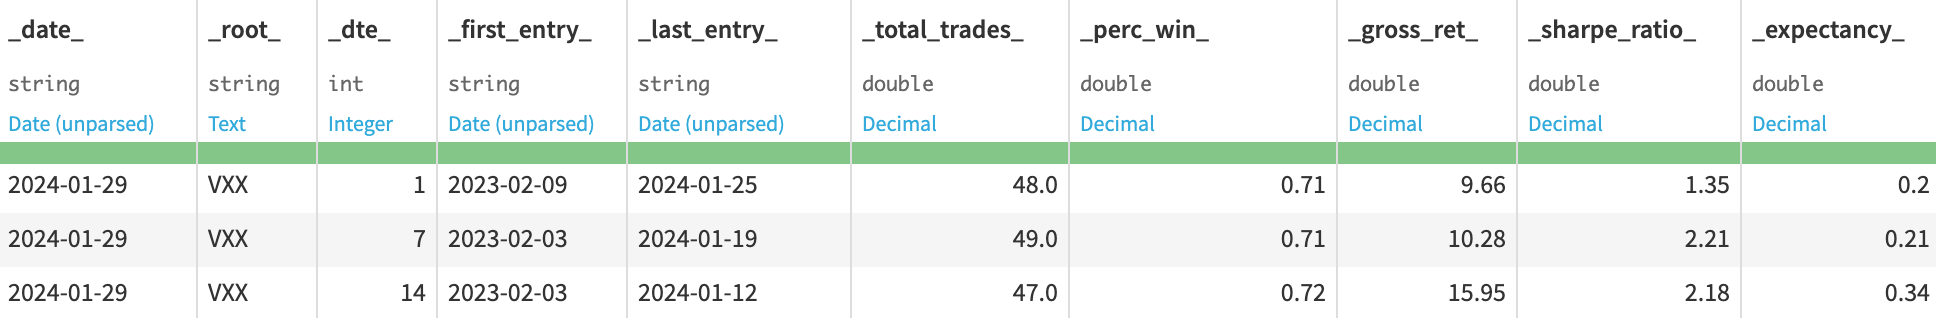
We've achieved an impressive Sharpe ratio of over 2 for both the 7 and 14 DTE trades. The 1 DTE trade, while yielding a lower Sharpe ratio of 1.35, still delivers a robust gross performance.
While we've traditionally advised against getting too close to gamma, there's a compelling case for focusing on the 1 DTE. The rationale is straightforward: in an unpredictable market like VIX/VXX, where surprises can emerge at any time, it's prudent to limit your exposure duration.
Nevertheless, our preferred position remains the 14 DTE: while unglamorous, it consistently pays well to be a garbage collector.
Be sure to follow us on Twitter @Sharpe__Two for more of our insights. If our work resonates with you, don't hesitate to share it with others who might find it helpful.
Thank you for reading Sharpe Two. This post is public so feel free to share it.
Data, charts, and analysis are powered by Thetadata and Dataiku DSS.
Have access to our indicators using our API.
Disclaimer: The information provided is solely informational and should not be considered financial advice. Before selling straddles, be aware that you risk the total loss of your investment. Our services might not be appropriate for every investor. We strongly recommend consulting with an independent financial advisor if you're uncertain about an investment's suitability.