There’s a debate that surfaces regularly in vol-selling communities. One camp swears by discipline and margin management: keep 30% of your buying power free, cut losers at a preset level, and you’ll be fine. The other camp says you need convexity, think cheap, far-out-of-the-money options that sit there doing nothing for months and then save your account on the one day that matters.
We side with the second camp. Not because discipline doesn’t matter; it does, enormously. But because the first camp is making an assumption they may not realize they’re making: you won’t always be able to exit when you want, at a price you’re willing to accept.
Stop losses, margin buffers, “I’ll just close it if things get bad”; these are all linear tools and they scale with the size of the move. They assume the market gives you a chance to act. Gap events don’t give you that chance. The market closes at 4pm on Friday, some geopolitical event, an earthquake and a tsunami, or macro shock hits over the weekend, and by Monday morning your position has moved through your stop, past your margin buffer, and into territory where your broker is auto-liquidating at the worst possible prices.
And even if the gap happens during market hours, good luck closing. During a real vol spike, bid-ask spreads on options widen dramatically. The put you sold at $5 with a $0.10 spread is now quoted $52/$58. Liquidity evaporates precisely when you need it most. You simply cannot cut your loss at a reasonable price and are paying the panic premium to get out.
We ran the numbers. SPY, real market parameters, eight years of empirical data, and a 100,000-path Monte Carlo using the Heston model. Four portfolios: naked strangle, cheap far-OTM tails with margin management, real wings, and real wings with margin management.
Let’s have a look.
Gaps happen more than you think.
Before we get into portfolio construction, let’s talk about how often the market actually gaps overnight. Not March 2020, not August 2024; those are the ones everyone remembers. Instead let’s focus on the ordinary market conditions.
We pulled every trading day in SPY since January 2018. That’s 2,044 overnight windows and looked at close of day one to open of day two. Here’s what the data says.
SPY gaps down more than 2% overnight roughly three times per year. Once every 18 months, you get a gap exceeding 5%. The worst overnight gap in our dataset was -11.3% on March 16, 2020, the Monday after the market realized COVID was real. The August 2024 carry-trade unwind produced a -4.0% overnight gap. And then April 2025 happened; the tariff war delivered six overnight gaps exceeding 2% in a single month, including -3.5% on April 3rd, -3.2% on April 7th, and -3.0% on April 10th. Three of the ten worst overnight gaps in our eight-year dataset came from one month.
Now run the probability. Out of 2,044 overnight windows, SPY gapped down more than 2% exactly 24 times. That’s a 1.2% chance on any given night and you’d think small enough to ignore. But you’re not exposed for one night, you’re exposed for roughly 252 trading nights per year and this compounds quickly.
The probability of dodging a >2% gap every single night is (1 - 0.012)^252 = 5%. Which means there’s a 95% chance (near certainty) that at least one >2% overnight gap hits you in any given year. Counter intuitive, yet the math is often stubborn and therefore it’s not a question of if but a question of when.

And this is with SPY, an index and arguably the most diversified, most liquid equity instrument on the planet. If you’re selling premium on individual stocks, overnight gaps from earnings, FDA announcements, or merger news are not rare events. SMCI lost 40% in a single session in 2024. NUGT, a 2x leveraged gold miners ETF, swung 30% in two weeks earlier this year. That’s the norm for single names and the probability outlined above converge even more to 1.
Spot drops and vol explodes.
When markets gap, two things happen simultaneously: the underlying drops and implied volatility explodes. Your short strangle reprices against you on both delta and vega at the same time.
Black-Scholes assumes constant volatility but the real world doesn’t work that way. The Heston model (one of the workhorses of derivatives pricing) treats volatility as its own stochastic process, correlated with the underlying. When the correlation parameter is negative (and for equities, it almost always is), a drop in spot mechanically drives vol higher. This isn’t a modeling choice but empirical observation that shows up in every vol surface, every day and we can measure it.
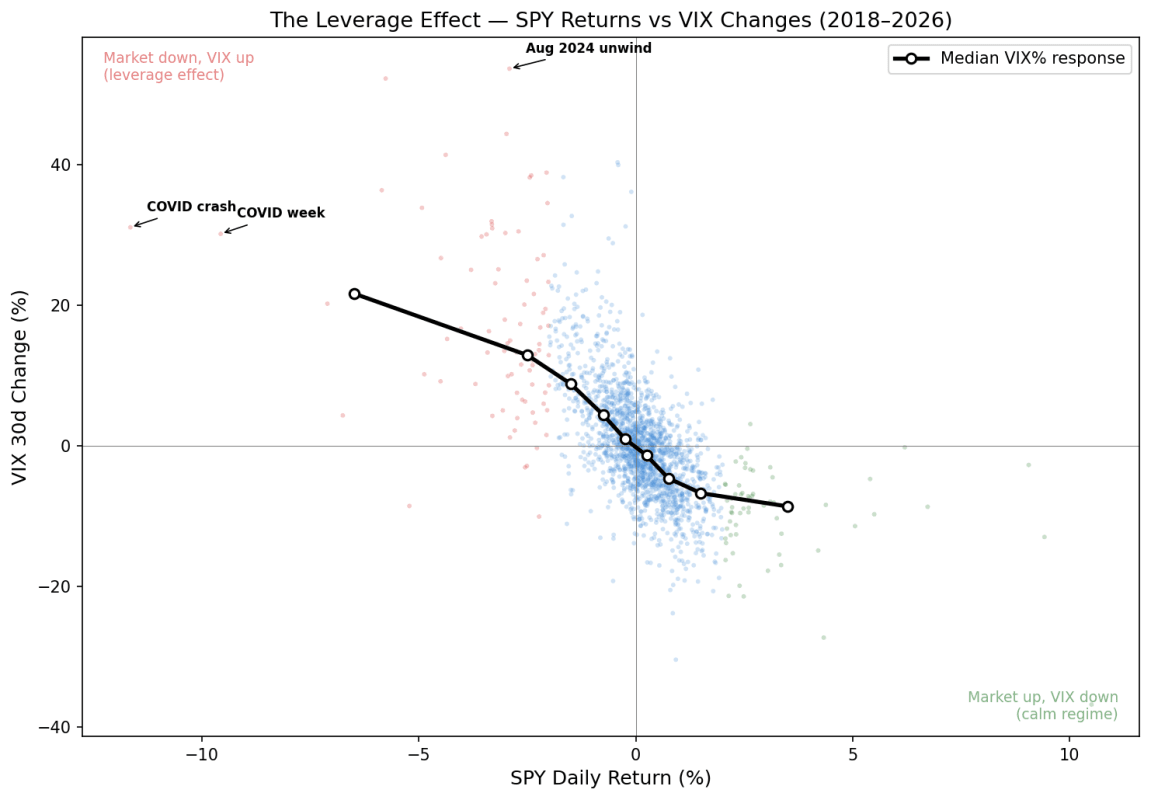
Using 1,973 trading days of SPY returns alongside VIX 30-day implied volatility data, the correlation between daily SPY returns and daily VIX changes is -0.73. The regression says: for every 1% the market drops, VIX rises by roughly 1.2 points. At a median VIX of 17, a 10% selloff should in theory pushes implied vol to around 29 or a 1.7x multiplier. That number is consistent with August 2024 but that is not always the case and depends a lot on the element of surprise, like in March 2020 when the actual multiplier exceeded 4x.
This is the piece most discussions miss. A 10% drop by itself is painful. A 10% drop where vol simultaneously multiplies by at least 1.7x is a different animal entirely. The put you sold for $5 is repricing somewhere north of $40, and the greeks that were decaying in your favor yesterday are now working against you at double speed. Your theta was earning you $0.20 a day; your vega is now costing you $12 per vol point. And this happened overnight; needless to say your stop loss never had a chance to fire.
Four Portfolios measured against 100,000 paths
There’s a taxonomy in the vol-selling community that matters here.
1. Tails are far out-of-the-money options: 1 to 7 delta, roughly three standard deviations from the money. They’re cheap, they do almost nothing in normal conditions, and some traders buy them as a safety net while relying on margin management as their primary defense.
2. Wings are closer to the money: 8 to 20 delta. They cost real money. They eat into your P&L every month. And they’re the ones that actually save you.
One camp says: buy cheap tails, manage your margin tightly, set a stop-loss, and you’re covered.
The other camp (our camp) says: those tails are too far out to provide meaningful convexity. You need real wings closer to the money, and you need them in a different expiration cycle so they carry vega when it matters.
We want to test this with data. So let's consider the 20-delta short strangle on SPY at March 20 2026 so about 35 dte at the time of this article and (646/709), collecting $8.77 in premium and define 4 portfolios, covering different way of thinking risk management and hedging
Portfolio 1 — Naked: No protection, no stop. Just the short strangle.
Portfolio 2 — Tails + margin management: Long 3-delta options at 217 DTE (410 put / 840 call, cost: $3.35) plus a stop-loss at 2x premium collected. This is the “cheap insurance + discipline” approach.
Portfolio 3 — Wings: Long 10-delta options at 217 DTE (540 put / 795 call, cost: $10.88). No stop-loss. The wings themselves are the protection. These are expensive (more than the premium collected in a single cycle) but they carry 182 days of residual time value after the strangle expires.
Portfolio 4 — Wings + margin management: Same 10-delta wings plus the 2x premium stop.
As per the exit strategy we hold to expiry and let the strangle runs to terminal, wings are marked to market at 182 DTE remaining. The simulation is pretty straightforward, two regimes Monte Carlo where each day are split into overnight (close to open, where your stop can’t fire) and intraday (open to close, where it can). Stochastic vol is calibrated to the empirical leverage effect we just showed you above and we run 100,000 paths. We also chose a starting point for volatility of about 19% which means the short position are not expected to make money: IV is roughly the same as RV (the subsequent realized volatility in our monte carlo process) and without a meaningful gap, the theoretical pnl is close to 0 over a large number of path.

Start with the naked strangle. It wins 59% of the time better than a coin flip and the expected value is -$6.51 per cycle. You lose money over time but the median is positive ($7.58) because most cycles are uneventful, but the tail losses are so severe that they drag the average deep into negative territory. 8.5% of cycles lose more than five times the premium collected.
Now look at the tails-plus-stop portfolio. Those 3-delta options at $3.35 combined with a 2x stop get you to +$5.41 mean and a 60% win rate. Better than naked, but barely. The tails are too far out of the money to provide meaningful convexity: when the market drops 10%, a 3-delta put at 410 strike barely moves. You’re relying almost entirely on the stop. And 42% of those stop triggers are overnight gap-throughs where you can’t exit at your stop price.
Let that sink in.
The ugly truth behind stop losses and why you need wings.
Nearly half the time the stop “fired,” it wasn’t because the market drifted past the level during trading hours. It was because an overnight gap blew right through it. The trader couldn’t exit at -$17.54: they had to eat whatever the market opened at.
And that’s when the psychology takes over. The loss has already materialized. The rational move is to close and move on. Instead, most traders enter hope mode, waiting for mean reversion, praying the market snaps back. It works more often than not in SPY because indices trend upward over time. But that recovery isn’t a volatility trade anymore. It’s a directional bet wearing a vol-selling mask. And if you’re running this strategy on individual stocks instead of an index, the reversal might never come.

Wings without a stop are the clear winner. 74% win rate and by far the highest of any portfolio with also the best expected value and a mean of +$9.31. And the worst path compresses from -$211 (naked) to -$72. Those 15 delta wings at 7 months dte remaining carry enough vega that when vol doubles overnight, they reprice dramatically in your favor. The convexity is real and it shows up where it matters.
And here’s the detail that should give pause to anyone relying on discipline alone: wings without a stop outperform wings with a stop. The wing-only portfolio wins 74% of the time versus 62% with the stop added. The stop whipsaws you out of positions that would have recovered, costing twelve percentage points of win rate for no improvement in mean P&L. Discipline is good. But a stop-loss on top of real wings is actively counterproductive.
How to apply it to your portfolio?
We don’t run iron condors. If we identify a chain as expensive (meaning the implied variance swap is overpriced) why would we turn around and buy options in that same chain? We’d be paying the premium we just called too high.
Instead, we run short premium and long wings as two separate business units.
The premium business sells options in the 0-90 DTE range. When our VRP signals say volatility is overpriced, we sell it. Short-dated, high-theta, driven by the data. That’s the revenue side of the book.
The reinsurance business buys far-out-of-the-money options in the 90-365 DTE range. Different expiration cycle, different part of the term structure. This separation matters for two reasons. First, longer-dated wings are cheaper per day of theta decay and your cost of carry is lower. Second, they carry more vega, which is exactly the greek you want working for you when vol spikes. When VIX goes from 14 to 35 overnight, those 180 day wings reprice more dramatically in dollar terms than anything in the front month. That’s the convexity doing its job.
Think of it like an insurance company. The underwriting division writes policies and collects premiums. The reinsurance division buys catastrophe coverage. You’d never run one without the other.
Two business units. One harvests premium. The other ensures survival. They don’t compete with each other. They complement.
Final thoughts
We get it: wings bleed theta, every single day, they lose a little value and it’s psychologically taxing. In a year where nothing dramatic happens they feel like a tax on returns.
We’ve had stretches, months at a time, where the wings expire worthless cycle after cycle and the temptation to drop them is real. But the math doesn’t care about your feelings. The day you stop buying them is, statistically, just as likely to be the day before the gap as any other day.
You’re buying the right to survive a gap event without getting liquidated at 4am. The right to come back Monday morning and rebalance calmly while the traders without wings are scrambling to meet margin calls, thinking of “defense mechanism” as if this was an NFL game or a war of attrition.
Remember, the best opportunities often appear when you can trade when others can’t.
We dedicate this article to the "hedge fund" manager with "sophisticated volatility models" who also believes IV Rank is a superior approach over rigorously trained ML models, and who has inspired us to write this article.