What Is IV Crush and Why Did It Just Cost You Money?
February 25, 2026: NVDA reports earnings. You bought calls three days before at $242, and the stock opens at $248.80 the next morning, up 2.8%, exactly what you predicted. You check your account expecting profits. Your calls are down 8%.
How? You were directionally correct, the stock moved in your favor, and time decay shouldn't hurt you that much overnight. You open the options chain and see implied volatility has dropped from 53.58% to 47.31%. That six percentage points dropped is what killed you.
This is IV crush, the sudden collapse in implied volatility after a binary event resolves. It happens after earnings, elections, Fed announcements; any event where uncertainty builds, then suddenly disappears. And if you aren't aware of that effect before you enter the trade, IV will ambush you, every single time.
Here's why IV crush happens, how much damage it causes, and how to identify it before you enter.
The Mechanics: Why IV Spikes Before Events and Crushes After
Binary events create uncertainty about future price movement. Option buyers bid up premium to hedge or speculate on the outcome and implied volatility is nothing else than the representation of that dynamic between supply and demand.
Before the event, IV spikes because the market expects a big move and the demand for options is extreme.
After the event passes, uncertainty always collapses: it doesn't matter if the outcome was good or bad, what matters is KNOWN versus UNKNOWN. Option demand evaporates immediately and IV crashes.
This IV collapse is what destroys option value and this IV swing kills your position through vega exposure.
Let's go back to our story in the introduction: delta represents your directional exposure, and you got that right in the NVDA example. Theta is time decay, which hurt you a little, as the proud owner of insurance premium.
But vega, your volatility exposure, is what killed you. When IV dropped 6.27 points (from 53.58% to 47.31%), that change alone was enough to wipe out your delta gains. The exact P&L breakdown depends on your specific strikes and position size, but the mechanism is universal: a 6-point IV drop on a 30-day ATM option can easily cost $3-5 per share through vega losses, often exceeding any gains from favorable price movement.
Ready to measure IV before your next trade? S2’s VRP scanner tracks 1,000+ tickers in real-time, showing you which tickers have elevated IV and when the next event occurs. Try it for 14 days for $14.
Real Examples: How Much Damage IV Crush Causes
The 2024 US Election The VIX fell 4.3 points overnight, from 20.10 to 15.80. The election was a weeks-long uncertainty buildup that resolved in hours. Binary outcome, one winner and one loser, no ambiguity. The market could immediately re-price without waiting for more information.
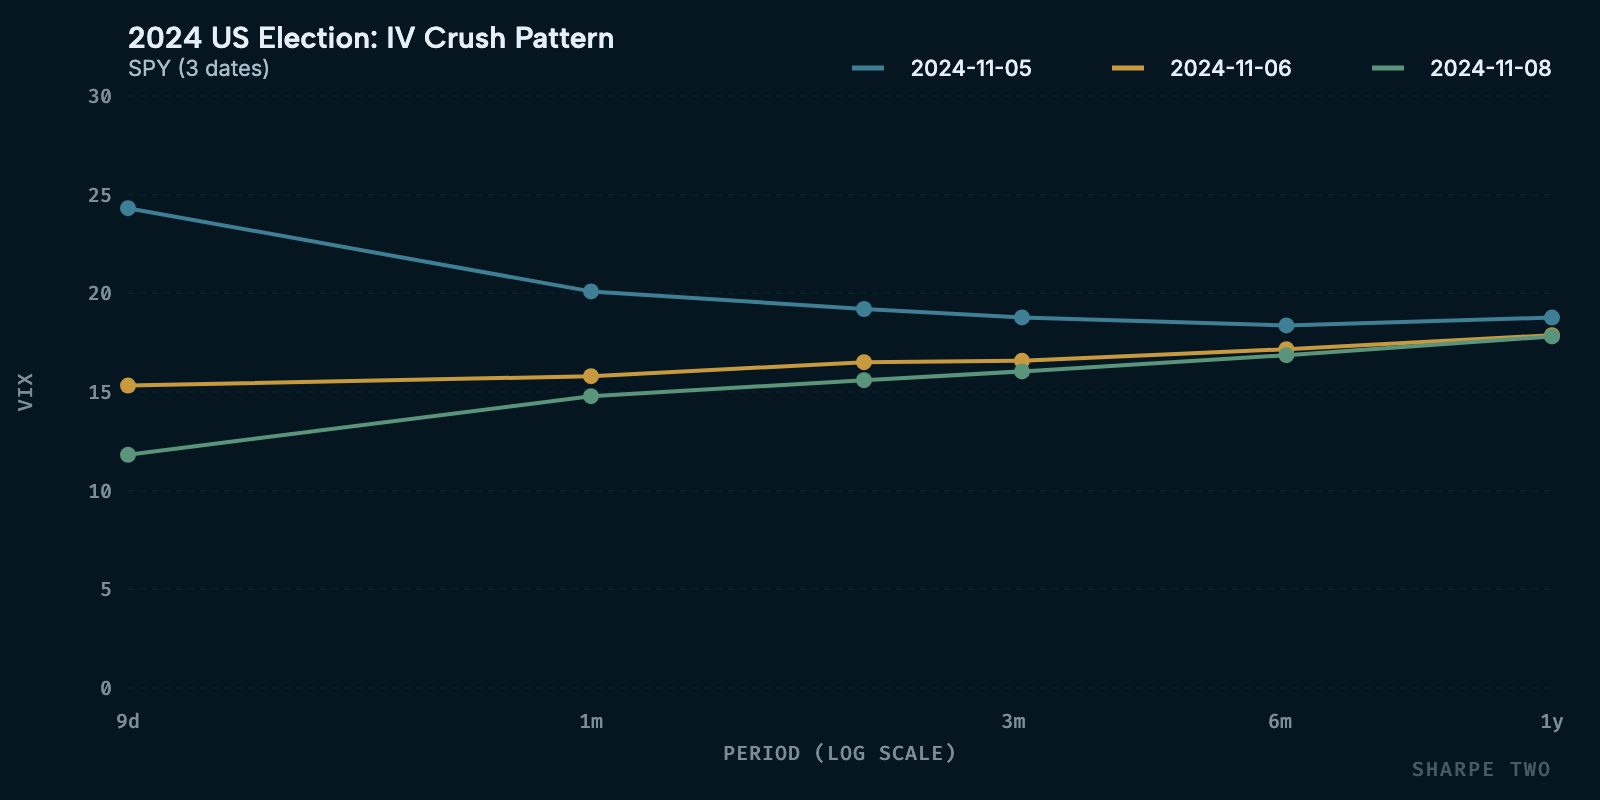
Chart 1: SPY IV + VIX dual-axis timeline, October 15 - November 15, 2024. Election Day marked with vertical line. Five-week climb, overnight crash.
In comparison, NVDA looked pale and one could argue, should it even count as an IV crush? NVDA's February 2026 earnings saw IV drop from 53.58% to 47.31%, a 6.27 percentage point crush with an 11.7% relative decline. Smaller than the election crush, but earnings happen every quarter. Academic research by Dubinsky and Johannes (2006) found average earnings IV drops of 15-25% across all sectors. Our recent data confirms typical earnings crushes run 6-8 percentage points for mega-cap stocks.
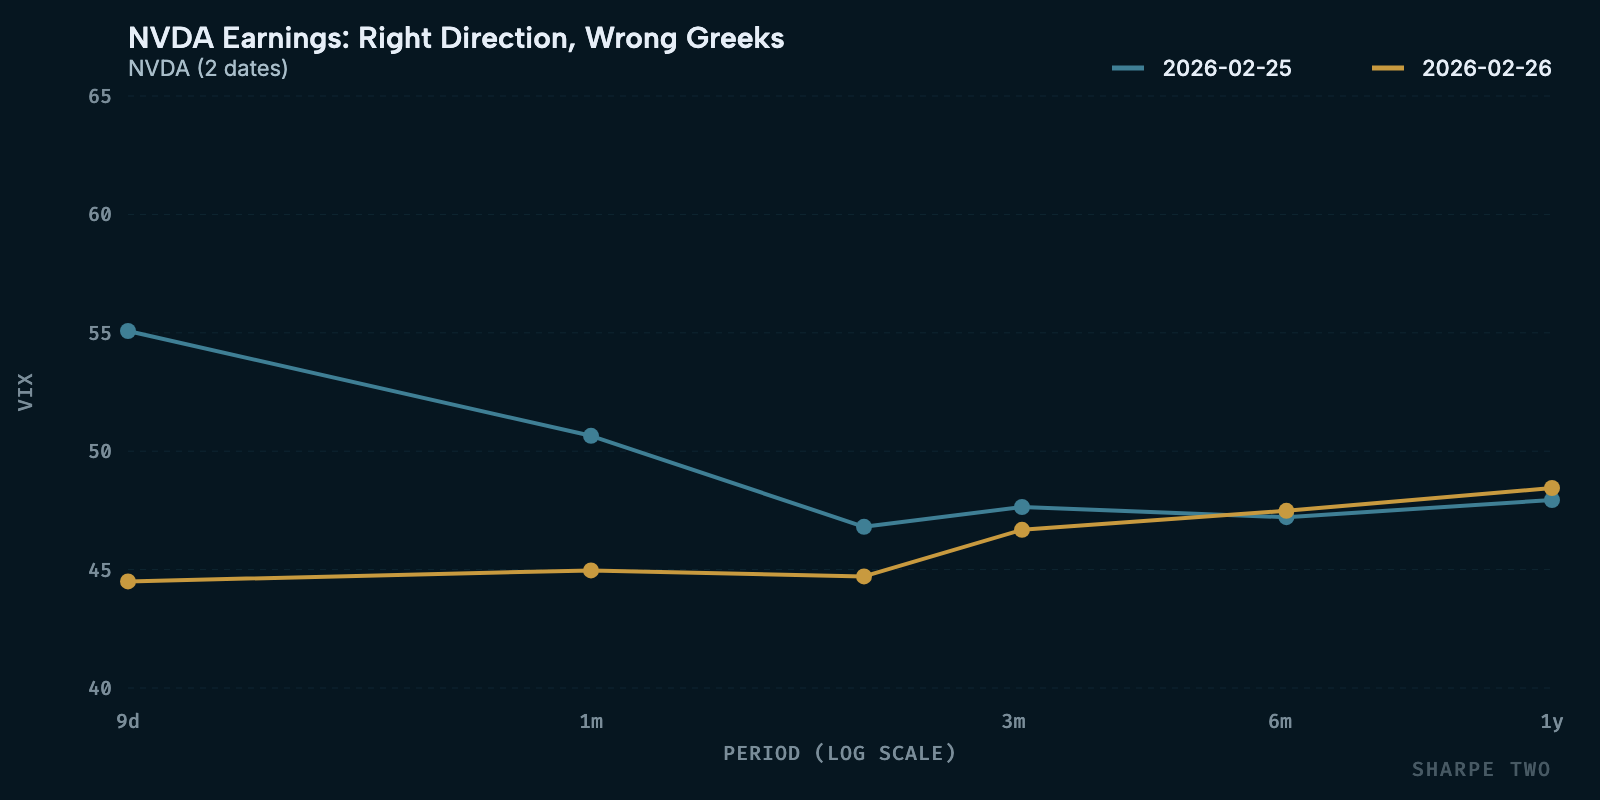
Chart 2: NVDA IV + price overlay, February 15 - March 6, 2026. Stock up 2.8%, IV crushed 6.27 percentage points. Earnings date marked.
Not all tickers crush equally. High-beta tech stocks like NVDA and TSLA see larger IV swings, while index ETFs like SPY and QQQ have more muted but reliable patterns. Single-stock options around earnings typically see 20-40% IV drops. Index options around macro events can drop 30-50%.
How to Spot and Avoid IV Crush: Your Pre-Trade Checklist
1. Check the VRP z-score
Variance Risk Premium (VRP) equals IV minus RV. The z-score normalizes VRP relative to its historical distribution, typically ranging from -2 to +3 as documented by Carr and Wu (2009). When VRP z-score exceeds +2, IV is significantly elevated versus realized vol. Use S2's VRP scanner to find elevated opportunities. But here's the critical part: check whether the z-score is elevated because of an upcoming event. November 1, 2024 had a z-score of +1.83 (elevated), but the election was four days away — IV expanded further before crushing. October 10, 2025 hit +2.83 (elevated) with no near-term event, making it a safer entry.
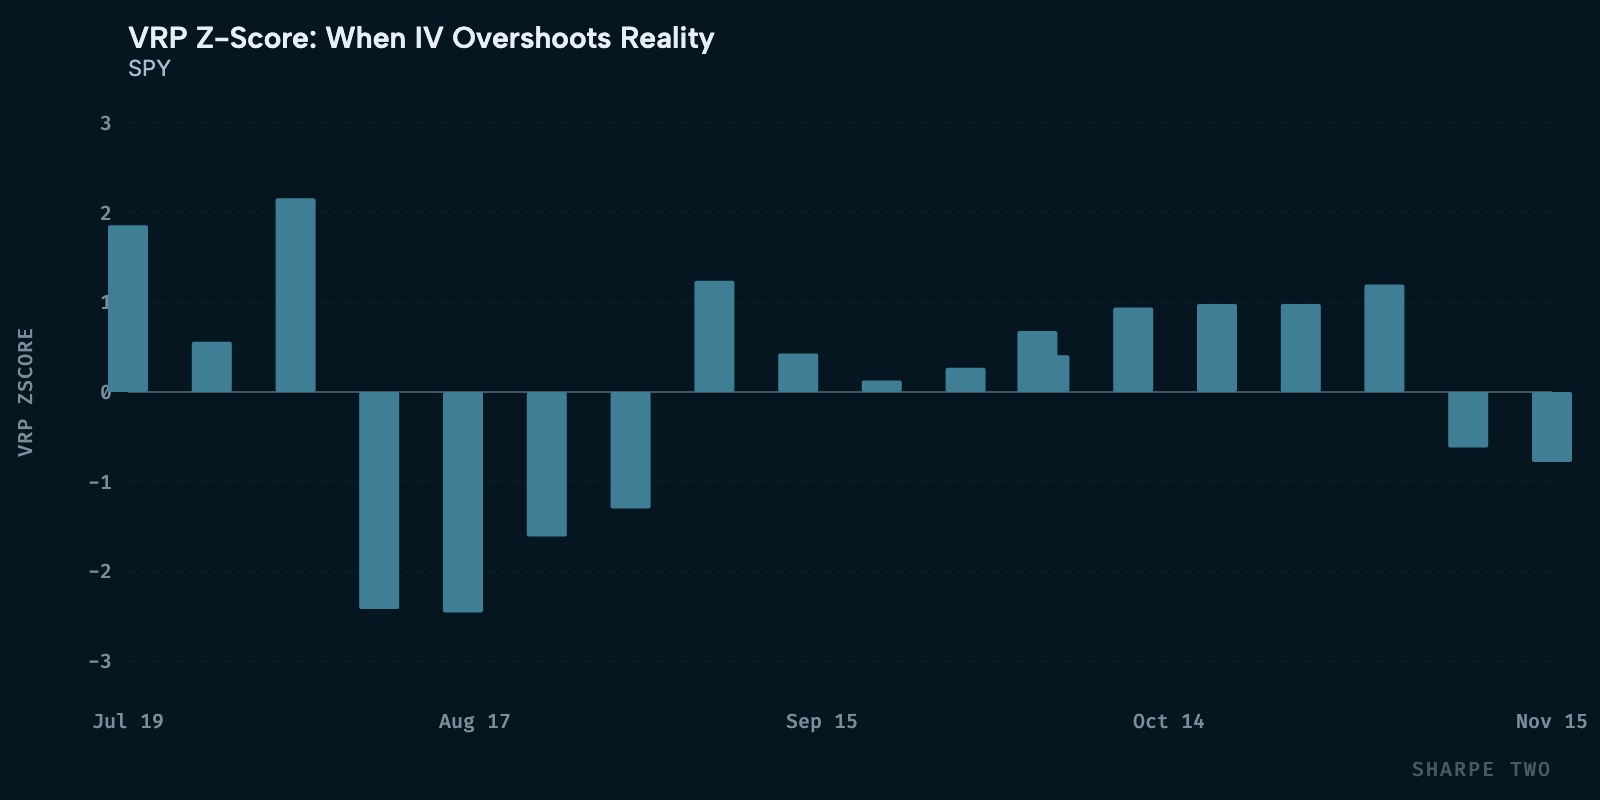
Chart 3: VRP z-score time series with ±2σ bands, September 2025 - March 2026. October 10 spike (+2.83) and November 6 post-election crush (-2.65) marked.
2. Inspect the term structures
VRP term structure shows how premium varies by expiration. Normal structure slopes upward — longer-dated options carry higher VRP. The warning sign is inversion, when near-term VRP exceeds far-term VRP, signaling near-term event risk.
But the real tell is often from the forward volatility term structure is particularly revealing because bumps or spikes at specific tenors tell you exactly when the market expects an event. If you see elevated IV at the 7-day tenor but normal IV at 14 and 30 days, the market is pricing something within the next week. These "event humps" in the forward curve are the market's way of broadcasting scheduled risk — earnings, FOMC decisions, or other known binary events. Research by Derman (1999) documented how option markets embed event expectations into forward volatility surfaces, creating observable "volatility cones" around scheduled announcements.
If you see inversion or an event hump, pause and make sure you actually want to harvest the event risk. Earnings are easy, lingering geopolical tensions like what is happening in Iran can be trickier. If you are not comfortable with the event risk, let it pass then enter after IV crushes.
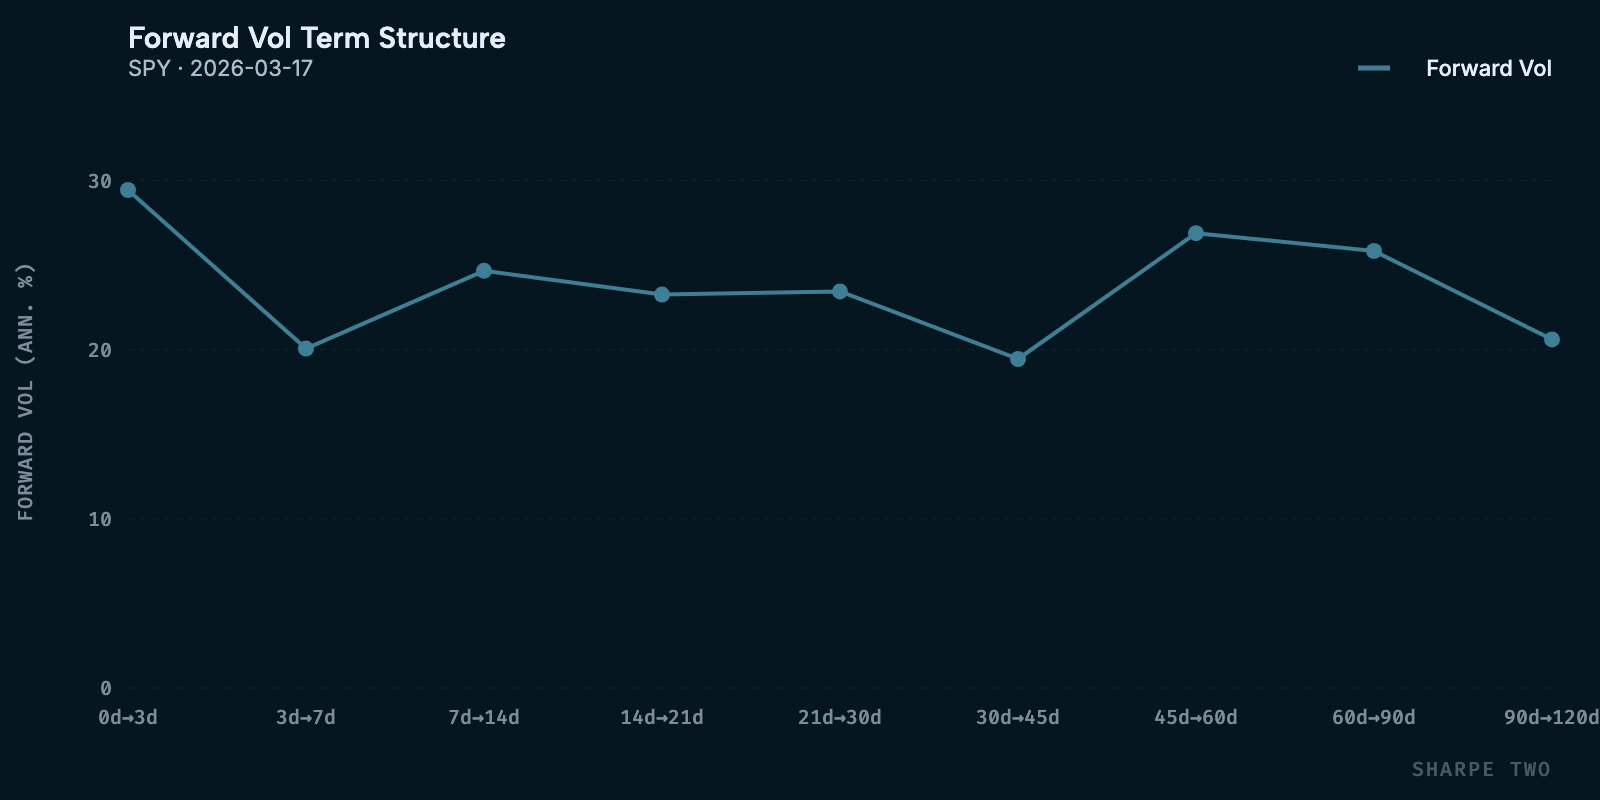
Chart 4: VRP term structure curves showing normal upward slope versus inverted structure (warning signal).
3. Check the economic calendar
Scan for FOMC meetings, CPI and jobs reports, elections, earnings announcements, and geopolitical summits. If an event falls within your days to expiration, either wait for it to pass or cut your position size by 50%. Selling 45-day strangles two days before an FOMC decision? That's a time to reduce size, not commit full capital.
4. Use calendar spreads if entering before events
If you must enter before an event, sell the near-term expiration to catch the IV crush and buy the far-term for protection. You profit when near-term IV crushes faster than far-term. This limits your downside if IV spikes before the event resolves. Your broker's platform will show you the net debit to enter the spread and the Greeks, making it straightforward to compare the risk/reward versus naked short positions.
Conclusion
IV crush is the rapid decline in implied volatility after a binary event resolves. Before the event, option buyers bid up premium to hedge uncertainty, inflating IV. Once the outcome is known, demand evaporates and IV collapses, even if the stock moved in the predicted direction. This crushes option value through vega exposure. It's the hidden risk in options trading that catches traders who focus only on direction.
The confusion typically starts with a simple question: why did my call option lose money when the stock went up? The answer is that implied volatility crushed harder than your delta gains. Even when the stock moves in your favor, when IV drops significantly after earnings or events, your vega exposure causes losses that exceed delta gains. The NVDA example demonstrates this perfectly the stock up 2.8%, but IV dropped from 53.58% to 47.31%, causing calls to lose 8%. Being directionally correct isn't enough.
The antidote is measuring IV before you enter. VRP (Variance Risk Premium) scanners show you IV versus realized vol. The z-score tells you if IV is elevated historically. Term structure analysis reveals inversions, where near-term IV exceeds far-term IV, signaling event risk. These are practical tools that tell you whether you're walking into an IV crush or catching premium at the right moment.
S2's VRP scanner tracks 1,000+ tickers and you can see which one have elevated IV, when the next event occurs, and whether term structure signals safety or danger. This is what separates premium sellers who survive from those who blow up.
Stop guessing. Start measuring.
Start measuring. Try S2 for 14 days for $14 — see which tickers have elevated IV right now.
Ksander.