The equity market futures indicate a relatively calm opening this morning, with a slight uptick of about 0.5% as we write this note, despite the recent assassination attempt on former President Donald Trump.
We will monitor further developments throughout the day, but it seems the market is treating this as a close call but ultimately a “non-event.” Instead, it will be interesting to see if last week's story continues dominating the news and influencing positioning ahead of the next FOMC meeting.
In this context, we propose a long volatility trade in LQD, the ETF that exposes investors to corporate bonds. Long volatility trades are exciting, but we do not base this trade on some sensationalist macro view. Instead, it is grounded in the current context and solid analytics.
Let’s dive in.
After the crazy rally at the end of 2023, things calmed down in H1 2024.
Now, what does that look like from a realized volatility standpoint?
First of all, let’s put things into a relatively recent perspective and draw a few observations:
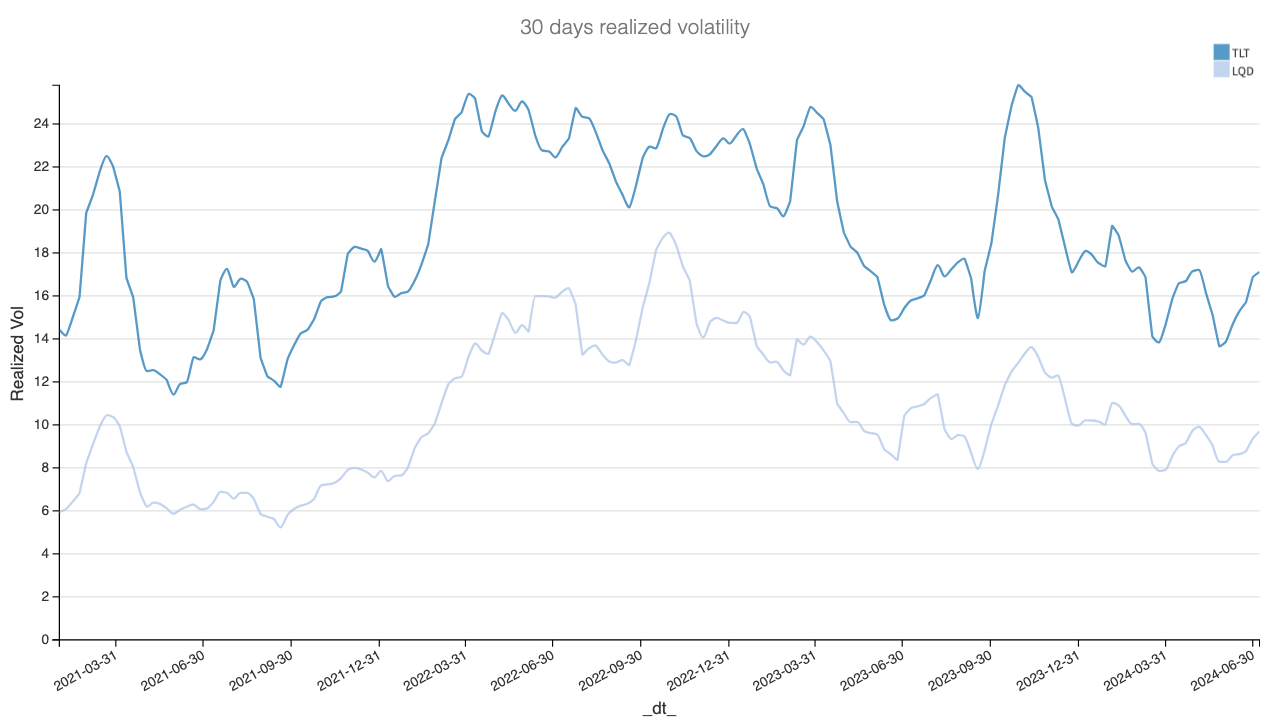
Before Q4 2021, when inflation wasn’t a hot topic, the realized volatility in LQD was very stable, mostly hovering around 6%.
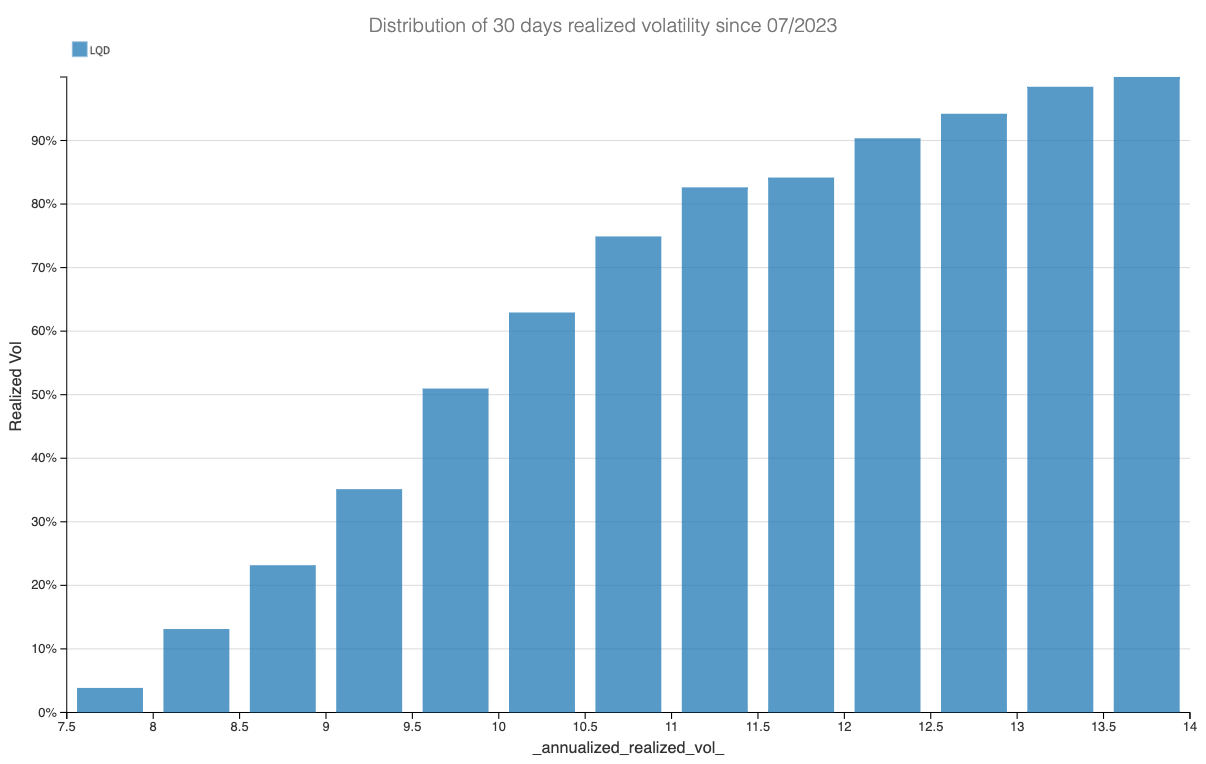
Today, with volatility sitting at 10%, it’s far from the peak observed when the Fed hiked rates at a record pace. It is clearly on the lower average band of what was realized over the last 12 months.
So, we are currently within the range of observed realized volatility in LQD. Now, let’s examine how options prices have moved throughout this period to see if the market might be underestimating the potential for a significant move in the space, especially as discussions around inflation and rate cuts will likely intensify in the coming weeks.
The data and the trade methodology
Let’s start by comparing the realized volatility at 30 days in LQD to the variance swap at 30 days, using the bid price over the last few years.
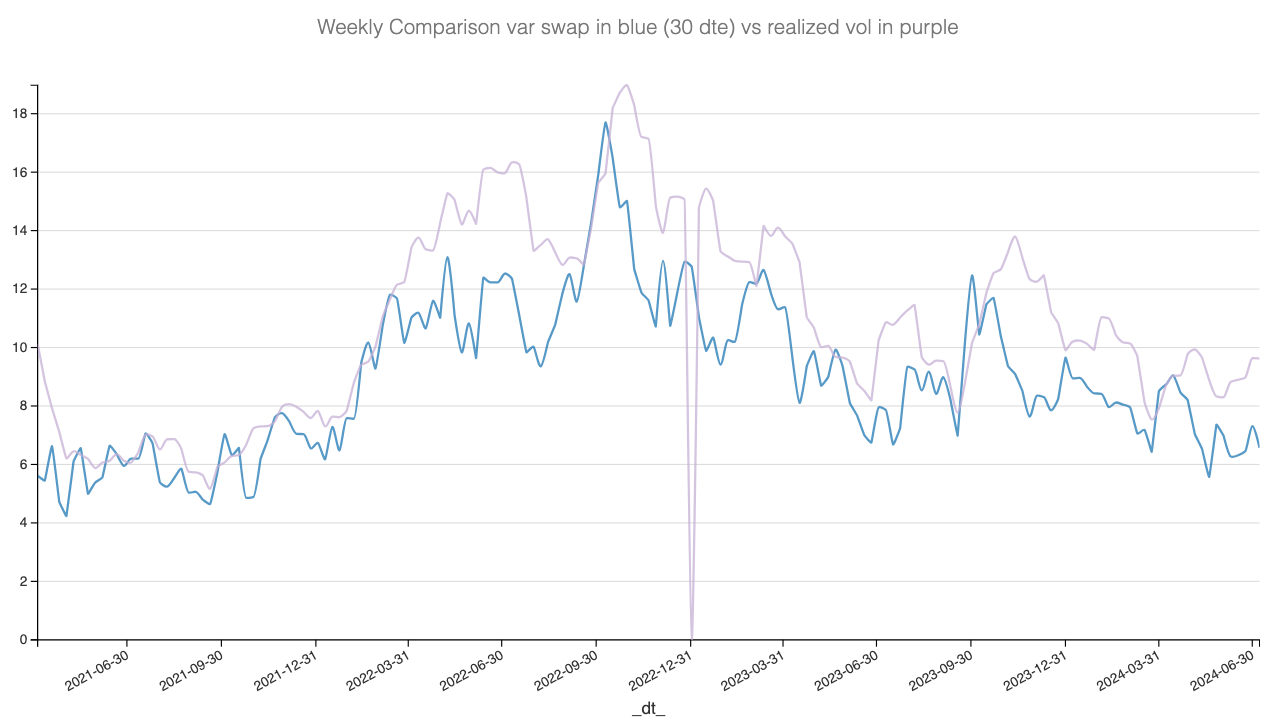
First observation: when using the bid price, the VRP is most often negative.