Yesterday, the combination of inflation numbers in the morning and the FOMC meeting in the afternoon resulted in fireworks in the stock and bond markets. A new all-time high was reached during the session, with rates coming off as the perspective of inflation cooling off (or at least not increasing) grew stronger. There is now an almost guaranteed rate cut in September, but the Fed will remain data-dependent.
So are we.
Sharpe Two is, first and foremost, a data-driven publication (apologies for the no-show last Tuesday—those following us on Twitter know we faced a data outage). And with the VIX at 12, mining data to find good options to sell will be more complicated. Could we find gold on the long side, then?
Today, we analyze the prices in SLV, the ETF that exposes investors to silver prices. When we take a long volatility trade, we typically keep it as a tactical hedge. Not this time. Let’s have a look.
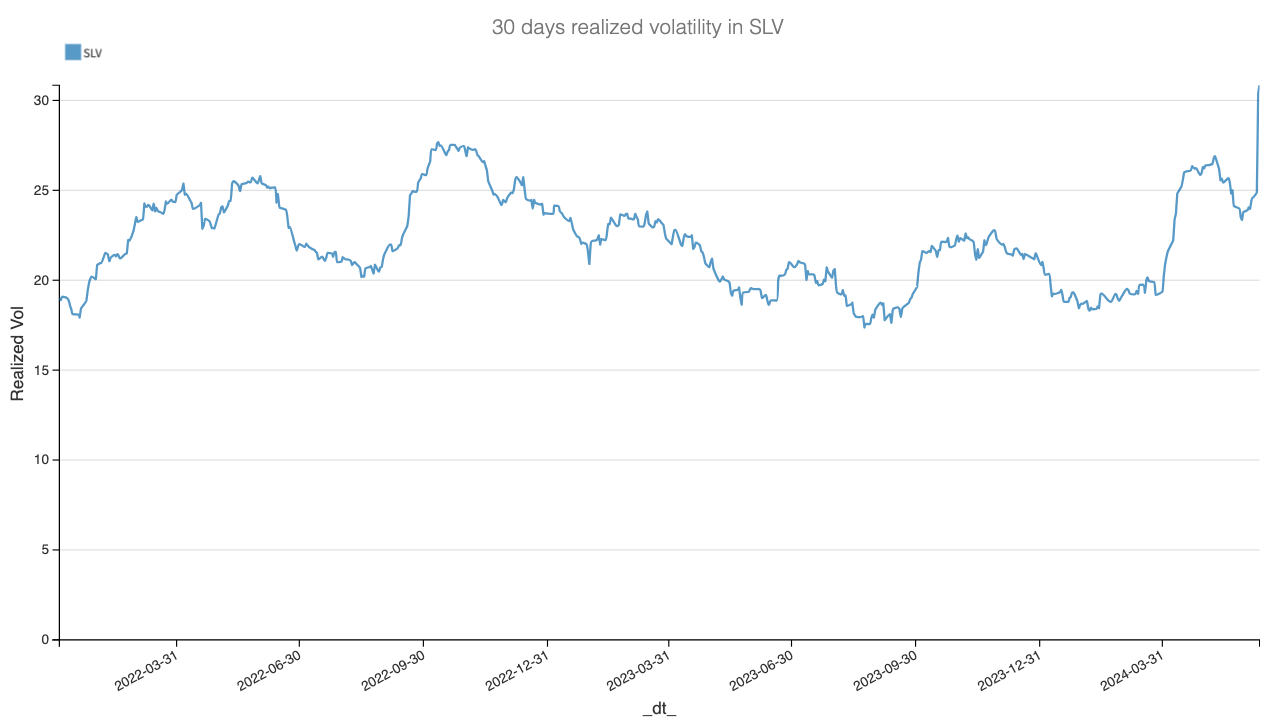
One thing is for sure: the realized volatility in these products has been slightly more elevated than usual, in line with some of the wild swings we’ve observed since the beginning of Q2 2024. It’s been trading at the high end of the range observed over the past three years. The move in the last few days has been particularly pronounced, catapulting the realized volatility above 30%.
Once again, it is hard to find a solid justification as to why, but we are not here for that. Instead, let’s compare the realized variance term structure over a few periods to see how similar things are.
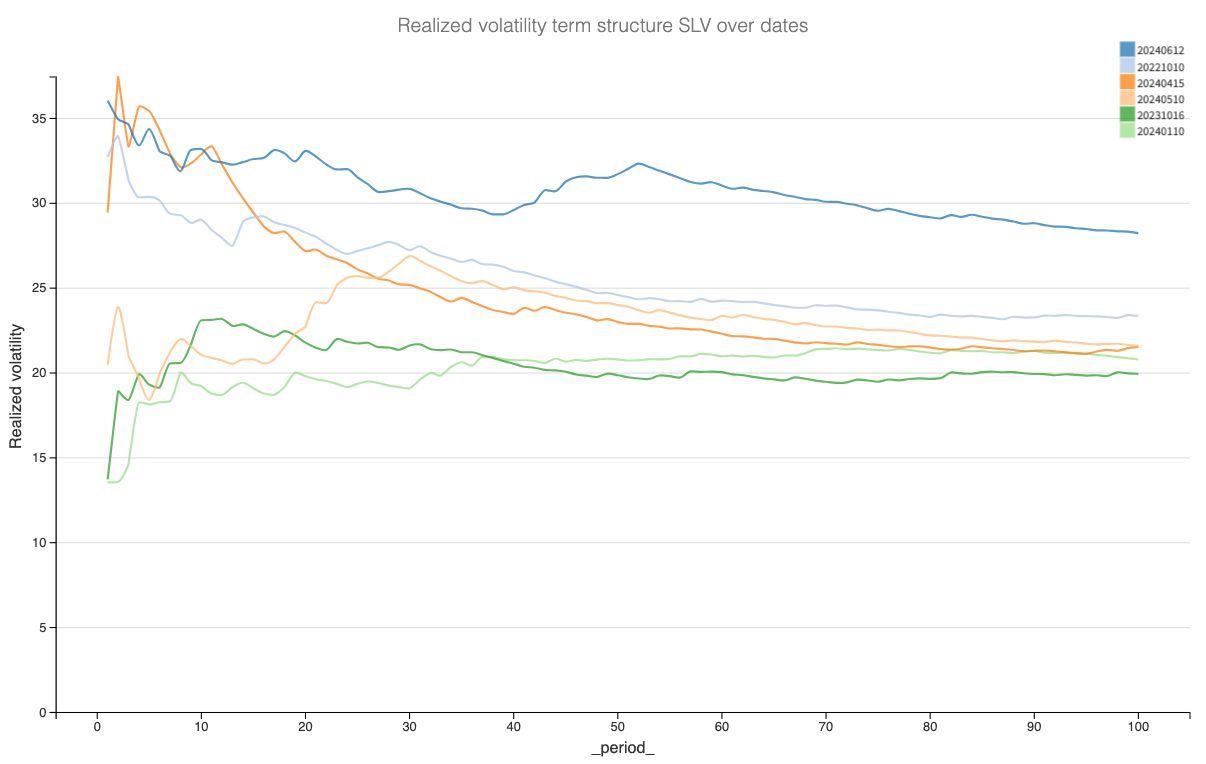
What is striking is that we are noticeably higher than the values observed in Q3 2023 when the market was getting anxious about the rate trajectory, and even much higher overall compared to Q3 2022, when fears of recession and hyperinflation dominated the marketplace. Could it be that we are simply in a different regime in the precious metals market and may stay there a little longer? It is possible.
In conclusion, it is indeed possible that the options prices do not reflect what is currently happening in the underlying and may be underpriced.
Let’s have a look.
The data and the trade methodology
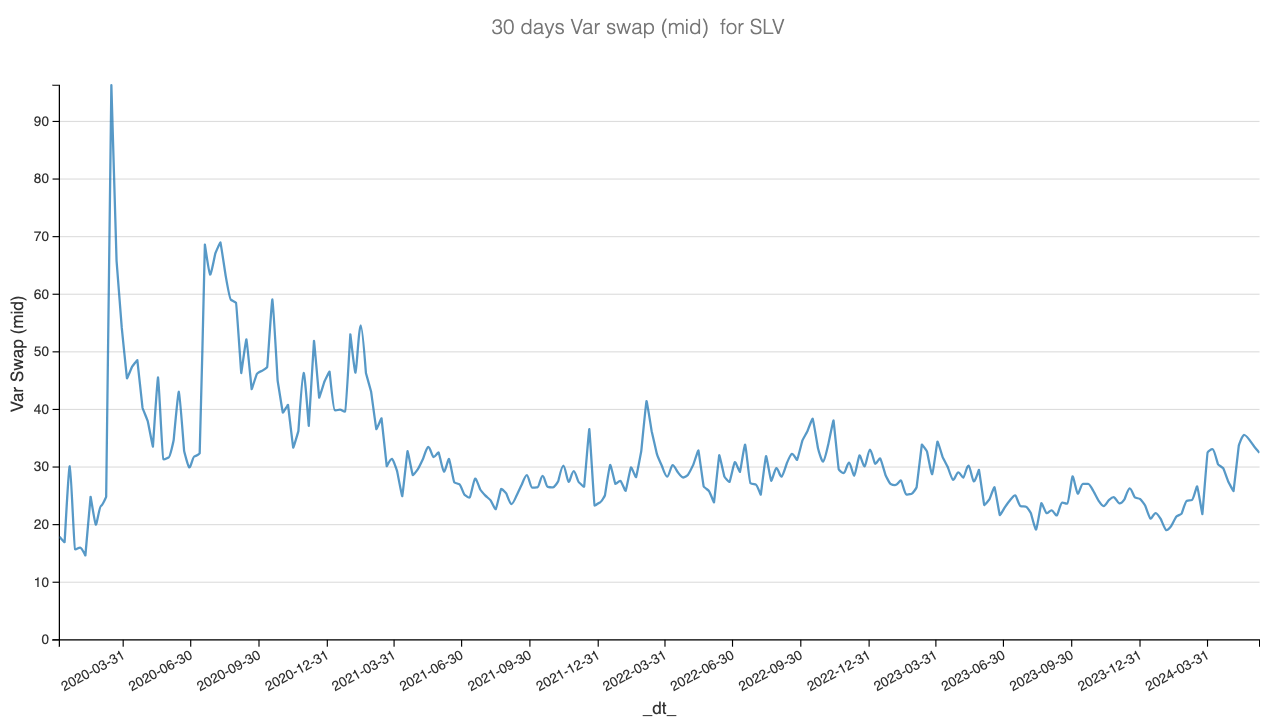
Let’s start by understanding where the implied volatility in SLV has been trading over the past few months. We compute the variance swap at 30 days using options mid-price.