The world didn't stop over the weekend, and Kashkari didn't drop another bombshell on market participants yesterday. As a result, every desk was busy sending or commenting on memes about the eclipse, and stocks didn't budge.
So, after yesterday's tactical hedge in SMH, we're returning to our regular programming and looking for solid opportunities on the short side of volatility. As a reminder, yesterday's move was tactical and certainly not a bet that things will go haywire—if markets are still quiet by Thursday morning post-CPI and FOMC, there won't be any reason to keep it.
Today, we're looking into a trade in the forgotten member of the big indices—DIA. Some young traders don't even know what the Diamonds are—the sweet nickname for the ETF tracking the Dow Jones 30.
I'm feeling nostalgic, though. Growing up in France, that was the only index from the US I heard about for almost a decade. Yep, a decade. I started pretty early, looking at the market in newspapers and catching the mention at the end of the 8 p.m. TV news program. What the internet has brought us is incredible.
Anyway, let's dive in!
The realized volatility has been consistently below ten over the past nine months.
First, it is the least volatile of the four, with a realized volatility averaging 8.5 over the first quarter of 2024. No wonder no one talks about it anymore—the volatility is much more present in QQQ and, to a certain extent, SPY rather than DIA. Here's what the realized volatility term structure looks like:
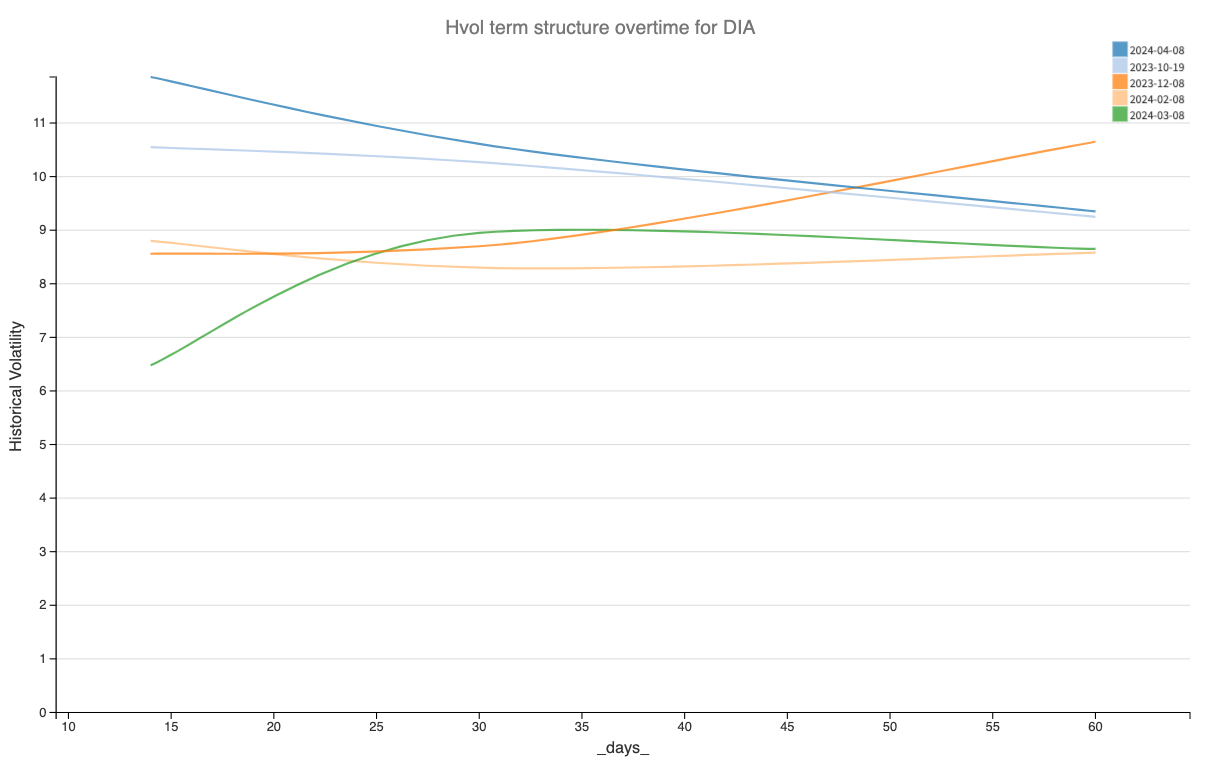
In line with the graph above, the term structure is the "highest" and the most backward since October 2023. If there were no new catalysts to move the market in the next few days, we could expect this curve to look a lot more like it did in March 2024: flat and with very little volatility in the short term.
This opens up some interesting perspectives on the short side of volatility, as long as we can confirm that implied volatility is overestimating what we've observed on the realized volatility front: exploiting the variance risk premium.
Let's take a look.
The data and the trade methodology
To begin with, let's examine the implied volatility term structure for DIA. We'll recompute a VIX at 14 days, 30 days, and 60 days using the relevant options data and following the CBOE methodology.