Following a turbulent Tuesday after the Labor Day weekend, the equity markets found some footing yesterday. But with a packed economic calendar between now and tomorrow afternoon, it’s wise to stay cautious with your delta exposure.
The positive side of the implied volatility spike we saw on Tuesday is that the VRP in the equity space has become quite noticeable. The 30-day realized volatility in the SP500 is around 16, and we expect it to hover around this level. Last week, we were hesitant about shorting VIX at 15, but at VIX 21, we feel a bit more confident. It might seem daunting, but is it really? Keep your risk exposure in check and let the variance game play out.
Today, we'll turn our attention to XRT, the ETF that provides exposure to the retail sector.
Let’s dive in.
The year-to-date performance hasn't been exceptional, but the swings in this product can be quite intense. XRT was no stranger to the wild movements in August, losing about 8% before clawing back those losses—only to be on track to lose them again.
Given this performance, it's reasonable to expect realized volatility to be fairly high in this ETF.
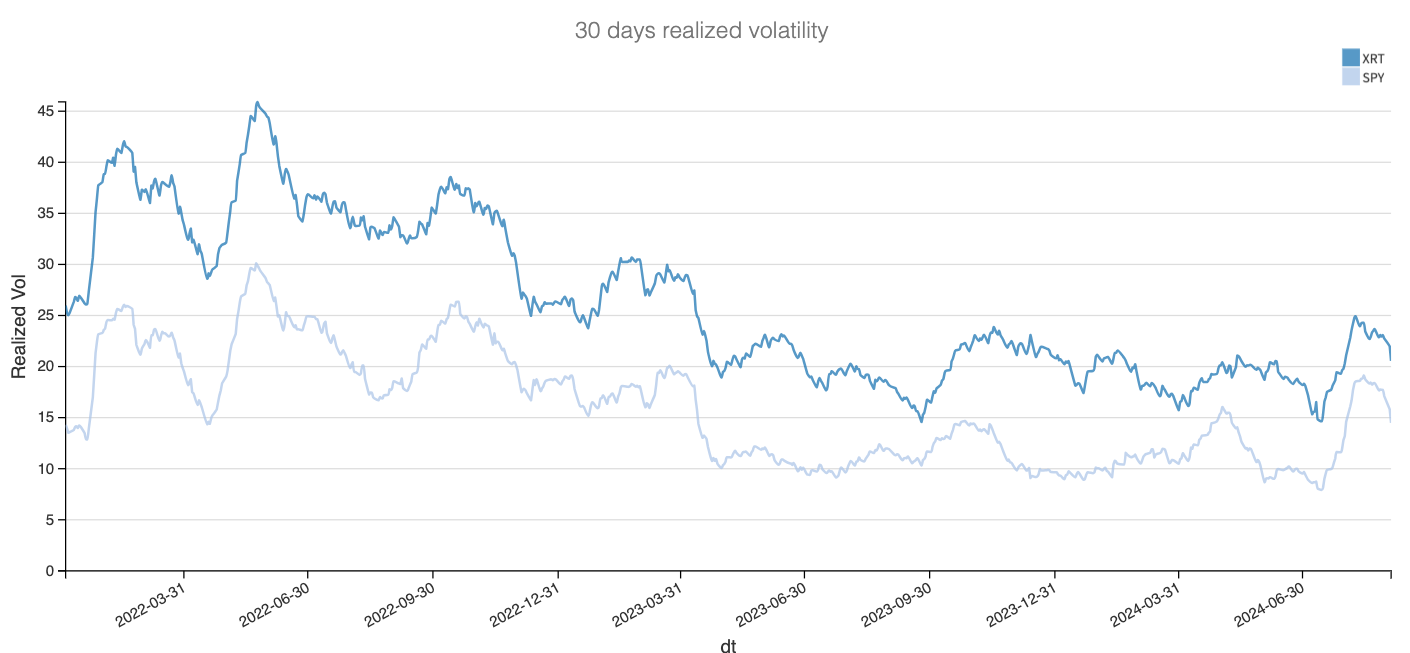
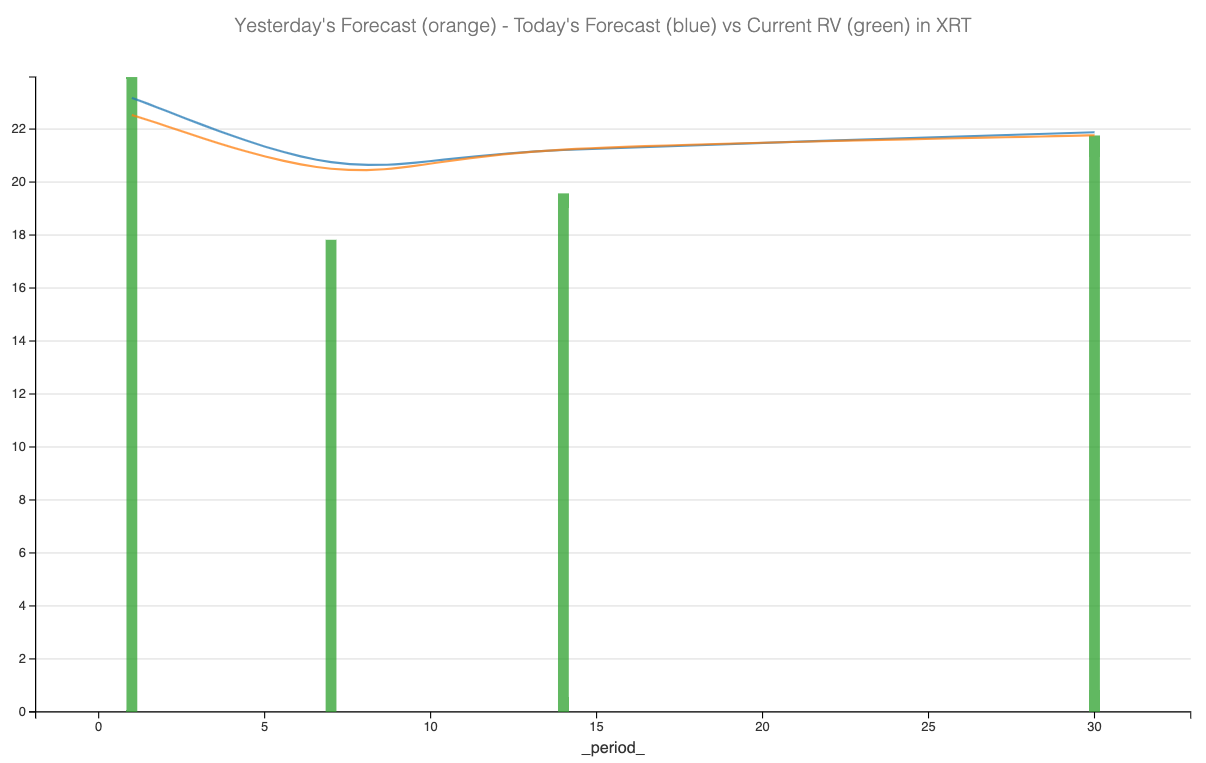
Indeed, after peaking at a yearly high of 25 in August, volatility has settled back to around the long-term average of 20, observed over the past 18 months. Our forecast indicates that we can expect realized volatility to hover around 21% over the next two weeks.
With that in mind, let's take a look at the data in the options market and see how we could structure a trade.
The data and the trade methodology
As usual, we'll compare the current level of realized volatility at 30 days with the implied volatility in options expiring in 30 days.