Two weeks ago, we talked about shorting implied volatility in the U.S. equity complex. It came right after the Fed meeting, which delivered exactly what markets were expecting: a 25 bps cut and the reassurance that at least two more were coming before year-end.
The market was a little wobbly in the days that followed. Many feared that good news would once again translate into bad news—or that the prophecy JPM had been preaching to its clients was one step closer to materializing: this time, the big one was just around the corner.
Fast forward two weeks, and that is not at all what we saw. In fact, we were out of that trade just four days after putting it on, as implied volatility got crushed while the market barely moved.
Let’s dig in and dissect yet another clean win—bringing our series to five out of five.
Realized went up a little but implied got crushed on that period.
As expected, realized volatility ticked up slightly, but never enough to threaten the trade. That means the carry opportunity we were banking on should have flowed nicely through the day-to-day mark-to-market via theta’s impact on PnL.
Implied volatility, meanwhile, came down quite a bit from its 23.5 level. By October 1st—just a week after the trade was opened—it had dropped to 21.2, and we should see that reflected in the PnL attribution in the next section.
And what about the underlying itself? Even when volatility stays contained, a strong directional move can still hurt—since we do not delta-hedge, a one-way trend could easily wipe out gains from carry and vol compression. Yet this time, IWM barely moved. It held steady for most of the trade’s lifespan.
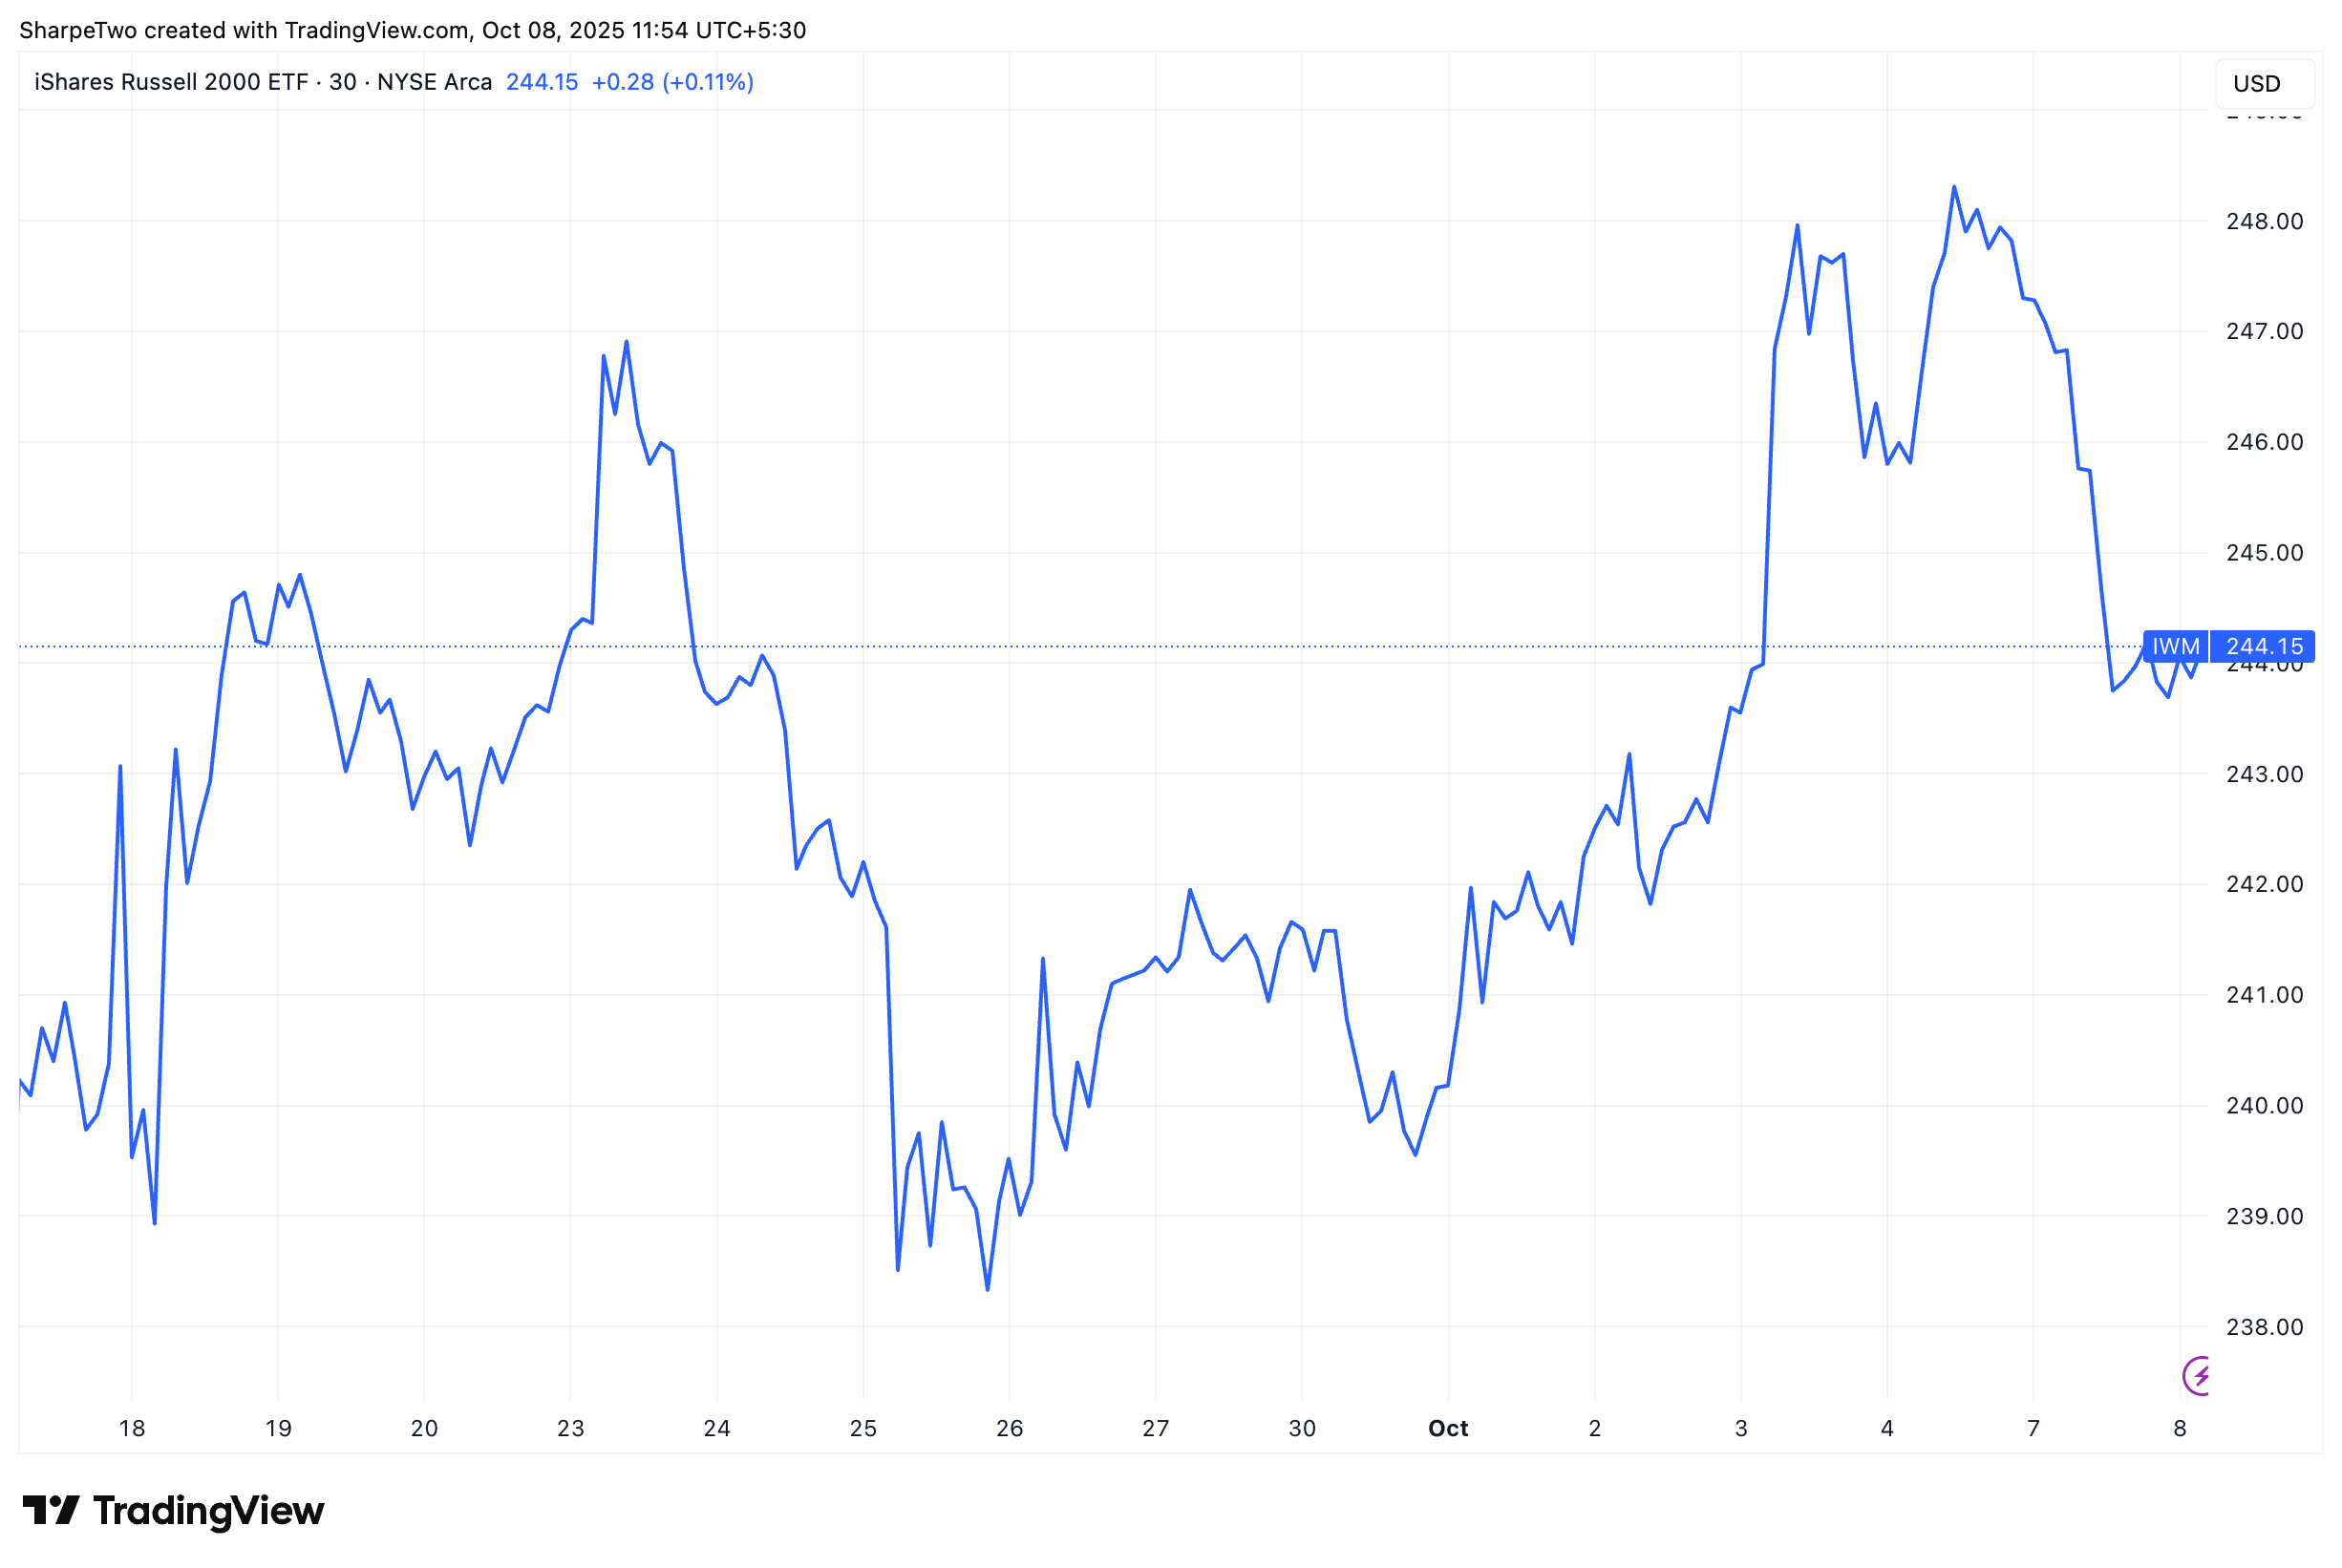
The first week stayed well-contained, with IWM barely straying from our 241 entry level. By the second week, when some movement finally appeared, we were already out of the trade—our profit target had been hit. We had entered for $3.8 and aimed to capture 25% of the credit collected, roughly $100.
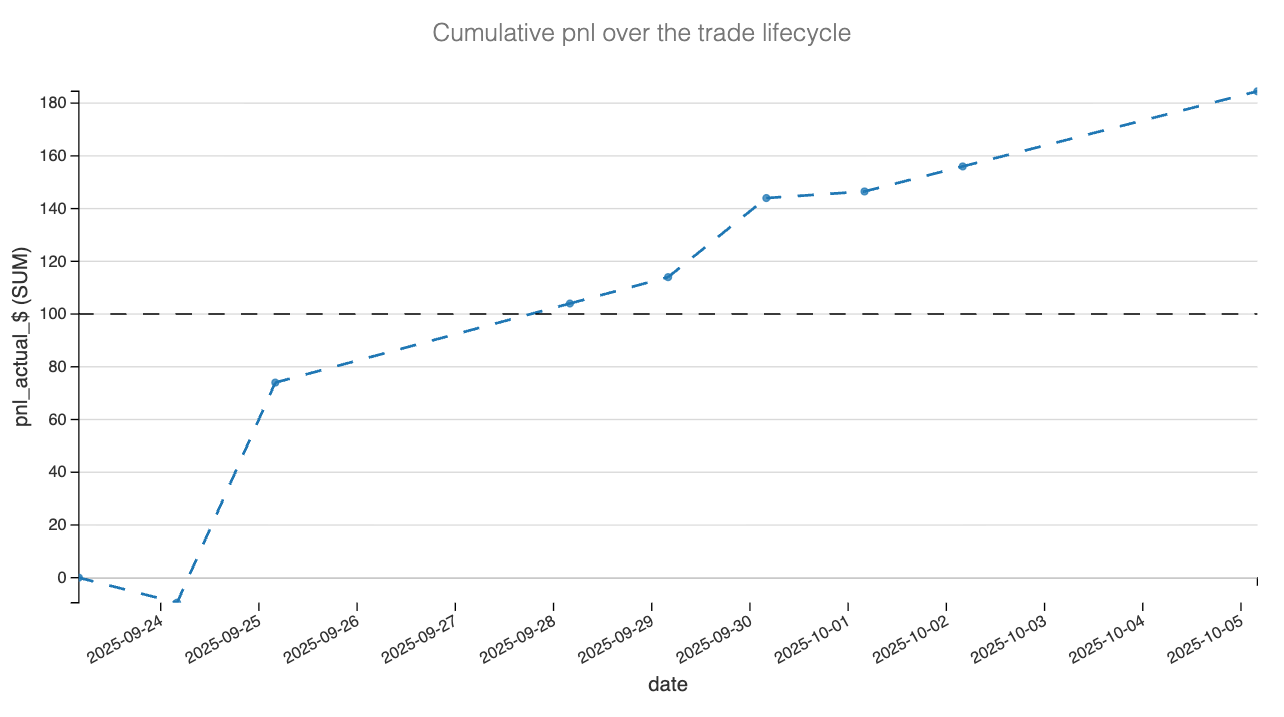
That target was reached by Tuesday—less than five days in the trade. The implied volatility crush was the main accelerator, as we will see in the PnL attribution.
Now, the elephant in the room: if everything was going according to plan, should we have stayed longer and doubled the profit? A fair question. But early October brought strong short-term signals suggesting realized volatility might rise.

And even though our October 31st expiry was comfortably far out and insulated from short-term tremors, we opted for caution and took profits as planned. Had those signals not appeared, extending the trade would have made sense—and we likely would have held it a little longer.
With that said, let’s now dive into the PnL attribution, Greek by Greek.
The greeks decomposition
We decomposed the 230/260 strangle day by day using end-of-day mid prices for options and translating the Greeks into dollar terms. As a reminder, our main buckets are delta, theta, vega level (parallel shifts in the surface), and vega skew (put/call shape). Finally, we use a residual bucket to capture higher-order path and effects.
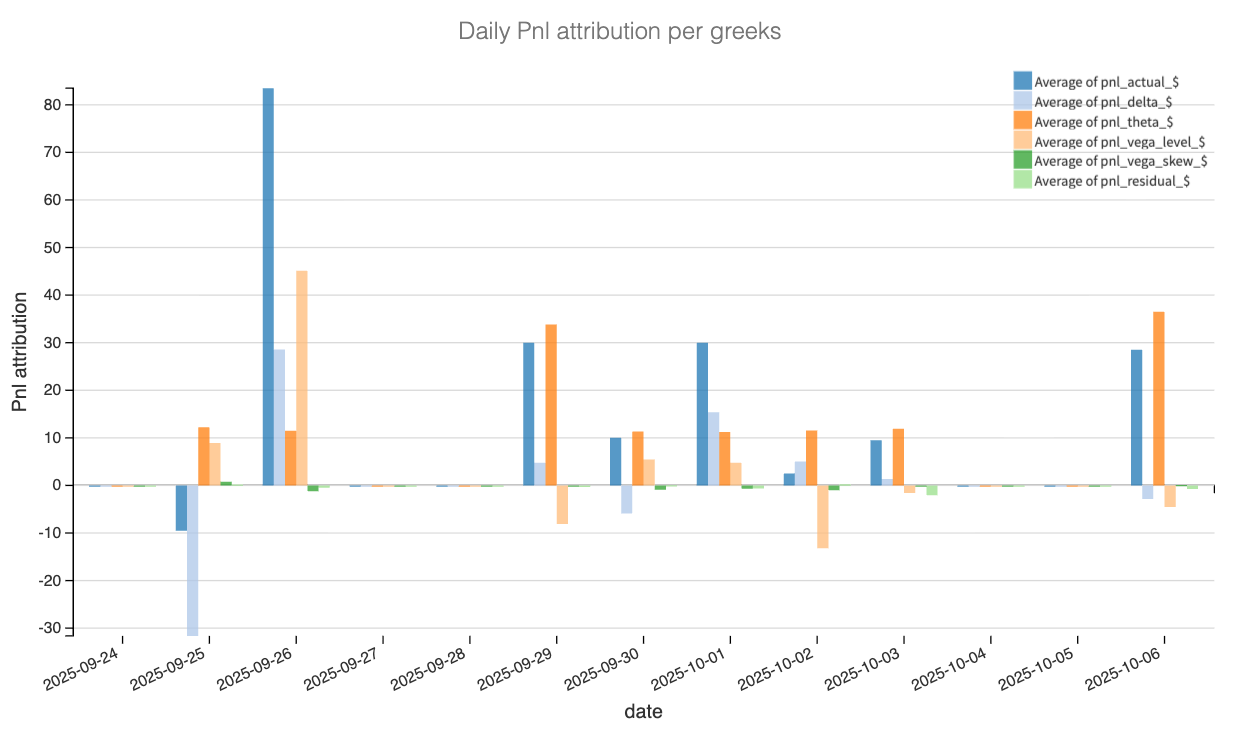
The attribution chart tells a clear story: the profit came almost entirely from carry and volatility compression, exactly in line with the initial thesis. Theta and vega-level effects were the consistent drivers from day one. The early mark-to-market bump visible around September 26 was a perfect reflection of the implied volatility drop from 23.5 to 21 — the strangle gained nearly its full two-week target within four sessions.
Day by day, the attribution confirms a clean short-vol environment. Theta accumulated smoothly as the position aged, adding incremental gains even on quiet sessions. Vega-level contribution dominated in magnitude, responsible for more than half of the total PnL, while vega-skew stayed negligible — skew barely moved as neither puts nor calls were particularly bid. That is consistent with a market repricing volatility in parallel rather than distorting the surface shape.
Delta exposure remained close to flat throughout the life of the trade, producing only minor daily swings. A few small negative delta days appeared when IWM briefly drifted away from the entry zone, but those were quickly offset by the carry component. The residual term, which captures non-linear and cross-Greek interactions, hovered around zero — always a good sign that model assumptions held and no hidden exposures crept in.
Altogether, the attribution validates the setup: over 70 % of the gains came from time decay and vol bleed, not from luck on direction. It is precisely what a short-VRP structure should look like — controlled, mechanical, and profitable as long as realized volatility behaves.
So at that stage, the only question remaining is, should we put the trade back in?
Let’s have a look.