What to find - why we accept the risk of not delta hedging our position and what we do instead with a straightforward, actionable trade as an example.
The fact that options are overpriced isn't, in and of itself, a justification to sell them blindly and hold them up until expiration.
Delta hedging has been so prevalent in literature because, surprise surprise, the underlying is moving. And even if it is not perfect, delta hedging is still the only way to consistently monetize the volatility risk premium (spread between implied and realized volatility).
Let’s understand the trade mechanics of selling volatility.

Pros and cons of delta hedging
When you sell a straddle (the most direct and efficient way to sell volatility), you bet the underlying will not move as much. Not that it won’t be moving at all.
With perfect delta hedging, if you have sold 20 in volatility and the realized at the end of the trade is 15, you make five volatility points.
What are the risks of not delta-hedging your position? Your initial bet that volatility would decrease could be correct, and you would still lose money.
How so? The underlying would need to drift orderly, realizing less than 20 in volatility but expiring outside your straddle's boundaries. Think about those long, painful trends up and down, where nothing is happening, and the underlying follow its course irremediably with no regard for those exposed to direction. Delta hedging protects you against that; you hedge the delta, i.e., the direction.
However, there is no free lunch, and delta hedging is hard.
First, for retail traders, the costs are not negligible as you need to buy and sell some shares constantly to stay neutral to the movement in the underlying. But it is also prone to error, and one little mistake can dramatically affect your pnl at the end of the trade.
We are not saying you should not do it or it is not worth it. Assess your risk tolerance carefully and decide for yourself.
At Sharpe Two, we believe in finding setups where the implied volatility is so overpriced that holding up until expiration without delta hedging still yields some generous returns.
This chart validates our hypothesis and displays the unique volatility profile of the three major ETFs describing the US indices. If IWM (in dark blue) is relatively overpriced for all maturities, that is in stark contrast with the period between 20 days to 35 days for QQQ (in orange) and SPY (in blue).
It doesn't mean that it isn’t profitable to sell options around these timeframes - it simply means that you will have to look after the position much more rigorously and delta hedge more actively.
A good analogy would be going through a turbulence zone. It may not be the best time to rely on the autopilot, and you should be prepared to engage with the aircraft actively to ensure everyone’s safety - in that specific instance, your asset’s safety.
However, no one will argue that being at cruising altitude with limited risk and a non-eventful flight is the best for the passengers and crew. That is what we are trying to focus on.
This requires identifying tickers and maturities where the market is constantly willing to pay a premium on terminal distribution and sizing our bet accordingly to account for the occasions where our initial assumptions on volatility were correct, yet the underlying ended outside of our boundaries.
XRT, a trade to put on autopilot (for now…)
Another glance at the chart above proves that finding these names isn’t straightforward. Except for IWM, the performance in SPY and QQQ doesn’t yield results, and they don’t look like great candidates to sell and hold, with no other form of strategy in the trading process.
Indeed, finding these names takes time and effort. Some rationale often supports it, easing the discovery process, and it doesn’t mean we should stop looking.
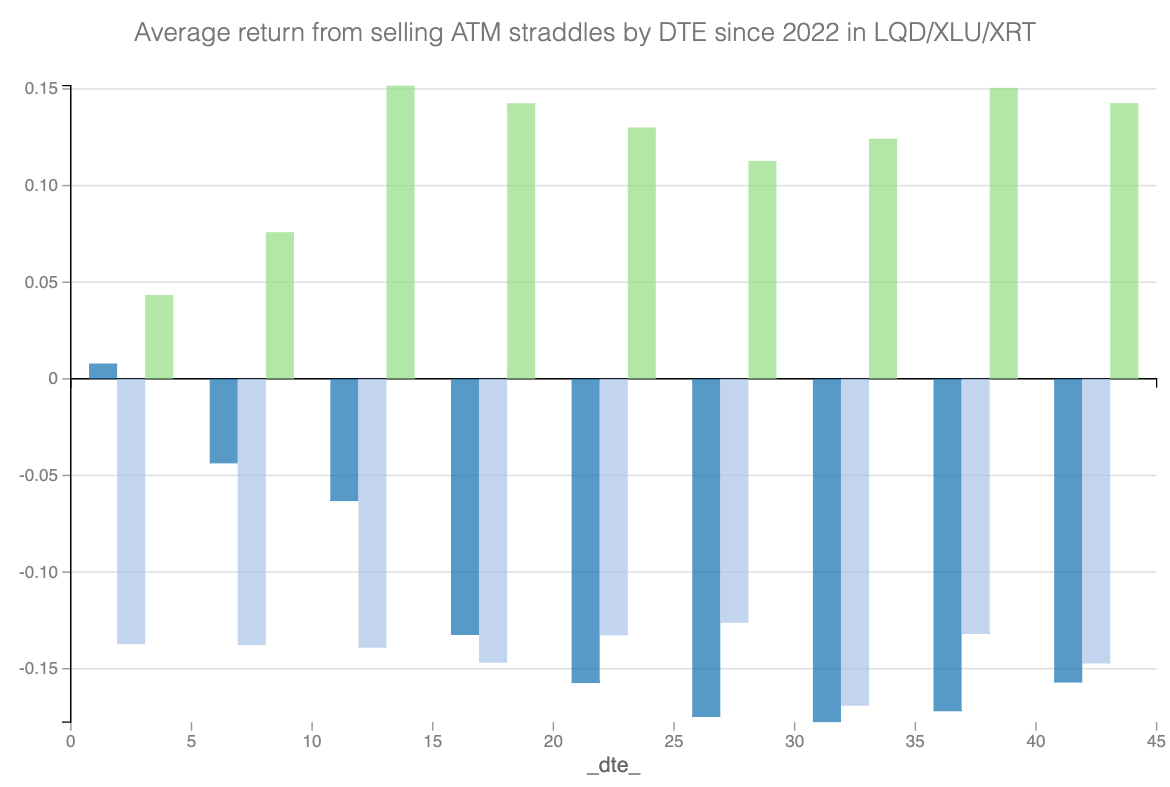
LQD is dark blue, XLU is light blue, and XRT is green.
The results for XRT look promising - this trade yields, on average, 15% when we focus on 10-15DTE contracts.
Remember, because of its collective intelligence nature, the market is far from being stupid despite what many social media accounts would want you to believe. If it is willing to pay a premium on something, assume it is for a good reason. In that specific case, it may be because something can blow up at any minute, and it is hard to predict how and when. Yet they have to be hedged against such eventuality, whatever the price.
Let’s look at 3 ETFs to exemplify
- LQD - tracks corporate quality bonds
- XLU - tracks utility companies
- XRT - tracks retail companies
Bonds of good quality are usually well-priced and not subject to a lot of surprises. AAA companies tend to pay what they owe unless a major economic slowdown occurs. The same goes for utility companies. You get a water or electricity bill every month; most people and companies will pay it, and the bad payers need to be more to put a massive dent in the company's profit.
Therefore, the premium on these names is usually reasonably priced, particularly on the short tenure. The market knows what to expect and, on average, won’t give you a dime more for it.
XRT is interesting in that sense.
It tracks a much more cyclical part of the economy than the other two counterparts used in comparison: apparel, automotive, computer, department store, etc. Anything retail consumption could decide to live without, particularly in an economic slowdown.
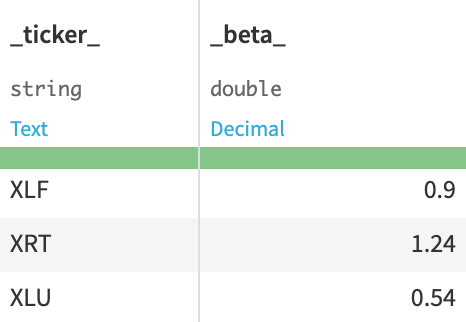
That is why it has a higher covariance (and therefore beta) compared to other sectors in the SP500.
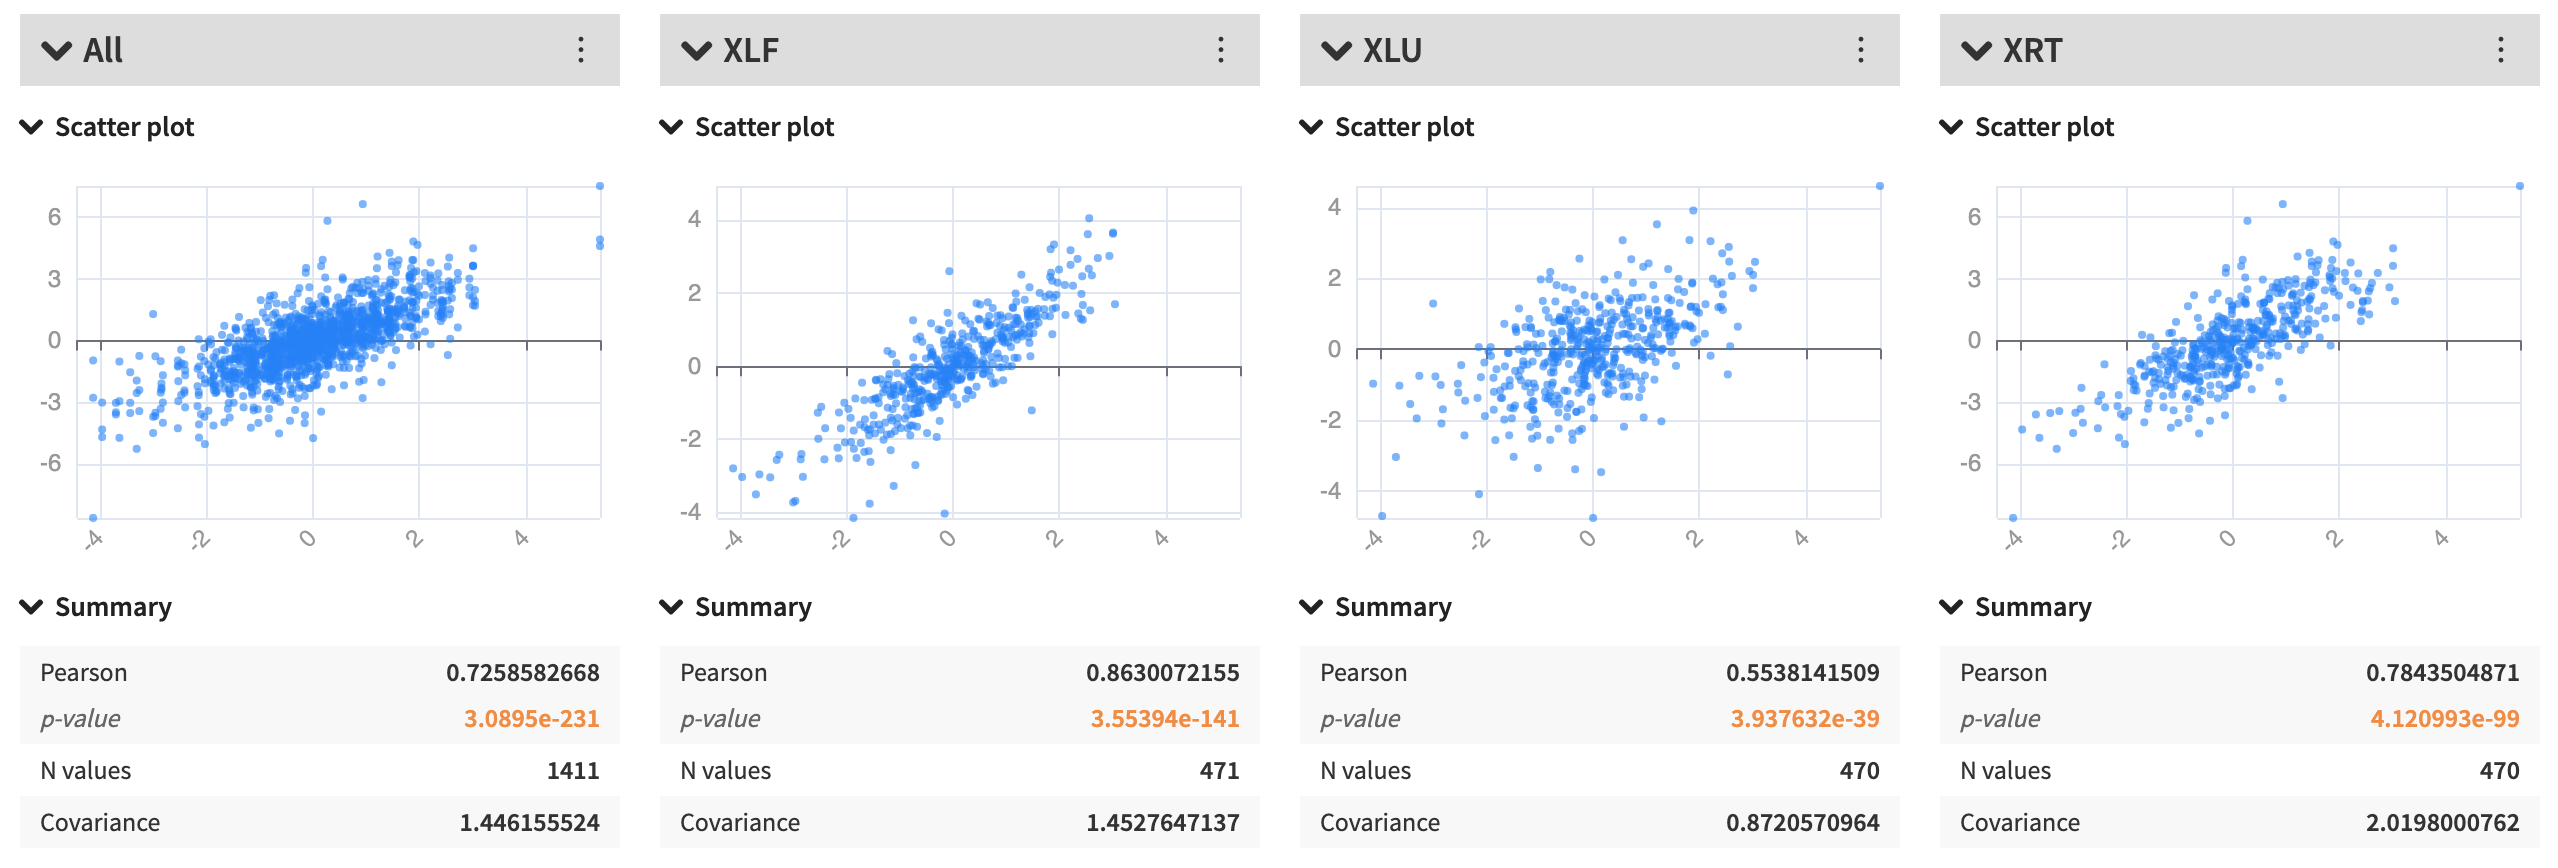
In traditional market portfolio theory construction, XLU, with such a low beta, would be considered a defensive ETF. In contrast, XRT, with a beta comfortably above one, would add risk and variance to your overall portfolio.
And because it is a riskier asset and more challenging to predict - consumer behavior is much more volatile than when it comes to utilities - the market is most of the time ready to pay a hefty premium for a risk it has some difficulty assessing correctly.
The trade methodology
- Sell every Friday an ATM straddle in XRT expiring in 2 weeks (14 DTE)
- The liquidity is usually okay, and you should get filled at mid-price
- Hold onto the expiration
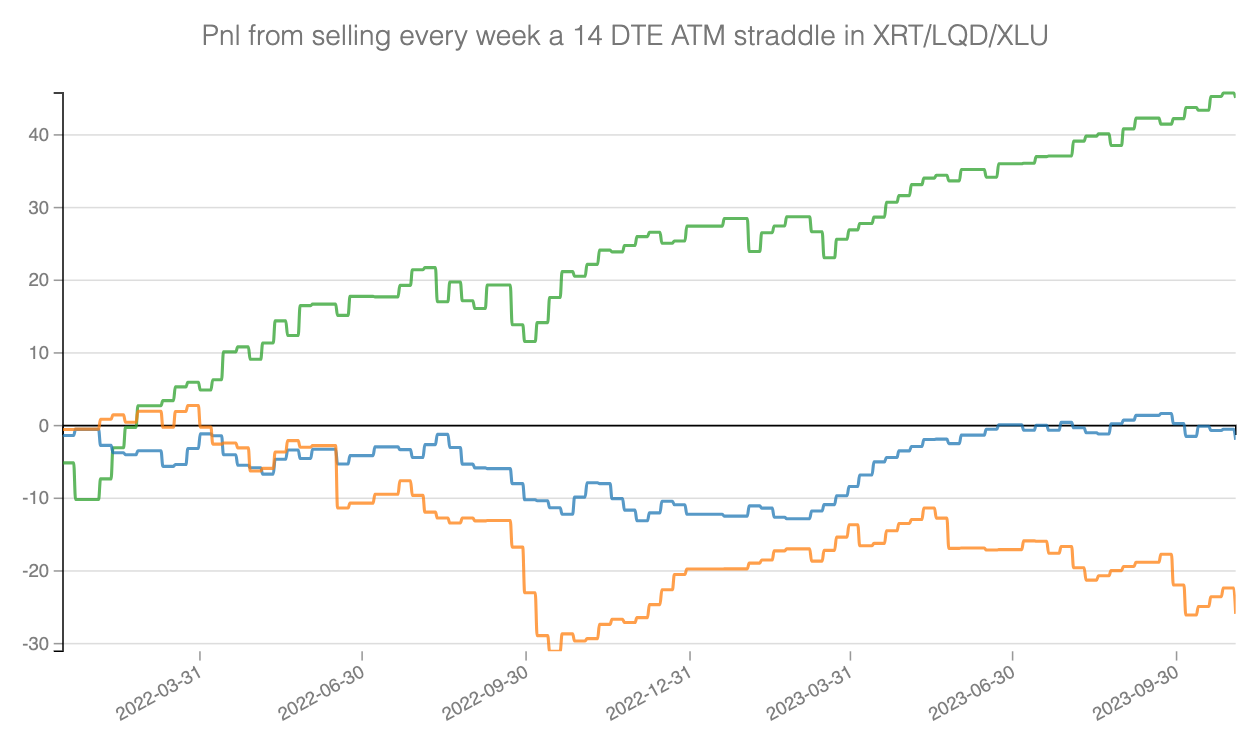
XRT is Green, LQD is blue, and XLU is orange.
Selling every straddle in LQD and XLU doesn't cause massive losses but doesn’t make money either. Sometimes, the implied volatility is overpriced, sometimes not, and things average over the long run.
However, the pnl for the same strategy in XRT is gradually growing as the market consistently overpays for these insurance contracts.
Keep in mind that this has only been since 2022, and the market has been expecting a potential recession with the rise of interest rates by the Fed since then. At Sharpe Two, we like these cross-sections between data and the macro world. We have some explanation for why it has performed exceptionally well, which will help us, as the macro environment changes, to monitor if the edge dries out.
Because the edge will eventually dry out, and as Nassim Taleb explained at length, it is not because something hasn’t happened yet that it will never happen. In that regard, explaining why it is drying out doesn’t matter. The explanation should help to put the trade on, not to keep it when things don’t work anymore.
Therefore, as with everything in trading, we do not recommend YOLO on this trade or borrowing against your house and gambling your kid's college money.
Something can happen anytime, and it will be at your own risk.
Invest wisely.
Subscribe now and get access to daily signals with high Sharpe ratio in your mailbox.
Data, charts, and analysis are powered by Thetadata and Dataiku DSS.
Disclaimer: The content provided here is for informational purposes only and should not be construed as financial advice.