“This morning, I bought a call broken fly because VIX term structure was in mild contango…”
You’ve read that line before. Maybe you’ve written it yourself. It sounds sophisticated, the kind of sentence that could only come from someone who knows what they’re doing. It mixes all the buzzwords of the moment and roll off the tongue with the weight of expertise.
But these metrics taken individually often lack any predictive power, particularly in the 0DTE space.
0 DTE are retail’s obsession because they are rooted in the ultimate illusion of control. It feels like what trading must be on a trading floor, and the stuff you see in movies; quick decisions, fast feedback, endless micro-structures to analyze. And there is “data” so it looks scientific and easily backtestable. But under the hood, it’s chaos: the closer you get to expiry, the more randomness takes over, and the more random a game is, the harder it is to distinguish it from .. gambling.
And hard to deny that, at least subconsciously, many traders are in 0DTE for gambling purposes. Nothing wrong with that, as long as you own it. But if you are trying to make money in options trading, complexity must directly impact your pnl.
It is easy to mistake complexity for edge. We often think the harder the model, the smarter the trade. And because 0DTE markets move fast, it is also easy to believe that activity is part of the strategy. There’s some truth to that: things do move fast and in 0DTE, options prices can shift meaningfully in minutes as prices whipsaw around and gamma does its thing.
The Illusion of Control
But that does not make it tradable, at least not for most people. Without institutional-grade execution, co-location, and a desk that’s built for speed, you’re not competing in the same game. What feels like opportunity is usually just noise in disguise and the market, of course, loves it: noise needs participants.
As you move closer to expiry, every signal decays faster than you can react. Order flow, gamma positioning, dealer hedging, they all collide and what you’re seeing on your screen is often just turbulence, not really signal. At that horizon, volatility is dominated by microstructure. Every tick becomes a feedback loop of market makers adjusting deltas, retail traders chasing momentum, and algorithms reacting to one another in real time.
Statistically, this is a signal-to-noise problem. The shorter the timeframe, the faster information loses predictive power. Noise rises exponentially while signal barely moves. In other words, the market becomes a blur.
And yes, 0DTE data often looks full of patterns. Because randomness creates shapes too and humans are wired to see meaning where none exists, especially under pressure. When traders say “it always does this after open,” or “GEX flipped positive so we’ll grind up,” they’re narrating the noise, and what they want to see. These assumptions rarely pass the test of a walk forward and a scientific process to test the outcome.
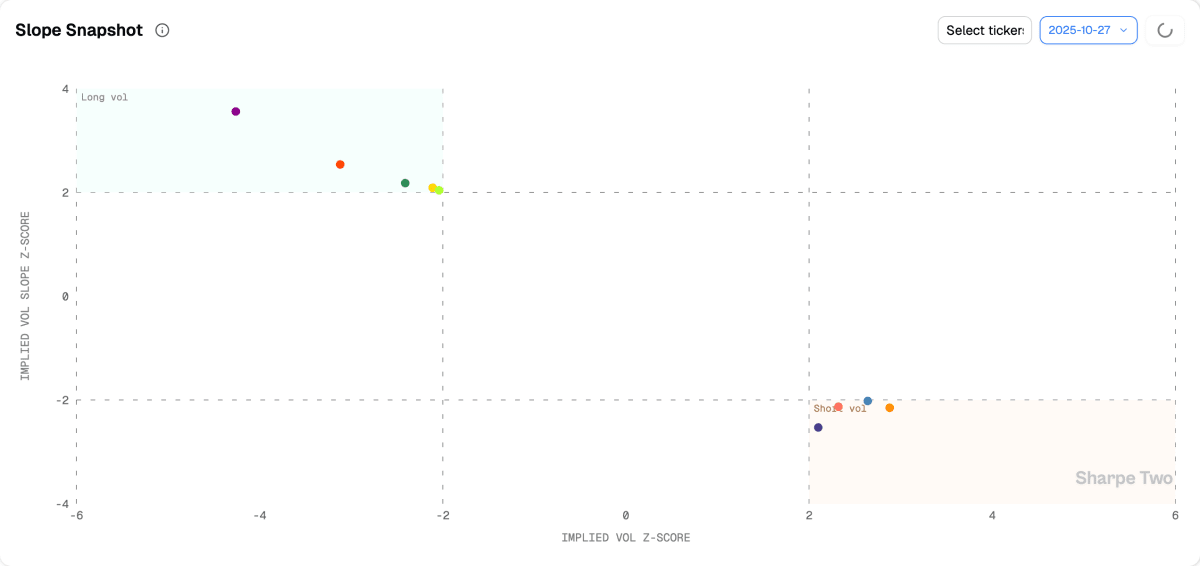
At Sharpe Two, we model vol surfaces on a 1,000+ tickers and take into consideration multiple time horizon and especially one 9 dte and another one at 30 dte.
When we test volatility features — VRP, skew, forward vol z-scores — across maturities, their predictive power grows as you move out the curve. In other words: the market only reveals structure when it’s given time to breathe.
Trying to forecast volatility with what’s happening at the 0DTE level is like trying to understand ocean currents by staring at the foam on a wave. You might get a glimpse of motion, but the real direction lies far beneath.
When the Market Stops Making Sense
But if the odds are so bad, why do so many people keep trying? Because 0DTE are seductive, like a dopamine loop disguised as opportunity. You can trade ten times a day, get instant feedback, feel in sync with the market’s heartbeat. Retail traders crave that immediacy. They can sense that things move fast, and they translate that instinct into a false conclusion: “If I’m not active, I’ll miss the move.”
That belief feels rational in a fast market, especially when you lack data and rely mostly on market feel. But that’s exactly what traps most traders: they mistake speed for necessity and activity for intelligence, when what they actually need is data easy to interpret and they can trust. The smartest person in the room will also say something stupid if pressed to interpret noise. So what that person usually do is just dismiss it, move on, and focus where making an analysis would actually be meaningful and deliver value.
Social media amplifies the illusion because it looks data-driven, but can you easily interpret them and ultimately trust them for your own trading? This is where it become debatable.
Everywhere you look, someone is posting elaborate screenshots of “GEX flips” or “expected-move breaches,” turning randomness into theater. It looks complex enough to be convincing.
Professionals think in the opposite direction and not because they’re smarter, but because they have reliable data and can effectively filter the noise to focus on case where the signal is strong.
They also know that when a system becomes too fast, signal collapses, so they step back. They look for persistence, not excitement. Their edge comes from identifying statistical repeatability, not anticipating the next tick.
The difference isn’t intelligence; there are plenty of smart, hard working retail traders. But too few have access to reliable dataset with predictable power like you would find on an institutional trading desk. The difference is not in brain, but in framework and structure.
Filtering, Not Guessing: The Sharpe Two Way
Retail traders interpret every fluctuation because they do not have the tool to effectively try to filter those who do not matter and focus on those where there is signal.
That’s the divide Sharpe Two is built to close — giving traders the tools to measure signal objectively, and the discipline to ignore what’s not statistically significant.
Filtering noise starts with a simple rule: if it cannot be tested, it does not exist.
That single principle defines everything we do at Sharpe Two. We do not trade stories or screenshots; we only trade probabilities. Every setup, every feature, every volatility metric is run through the same question: “What is the probability that implied volatility sold today will exceed realized volatility over the next horizon?”
If that probability is high enough -usually above 66% — the setup qualifies for review.
If not, it is ignored.
Not debated. Not reinterpreted. Just filtered out.
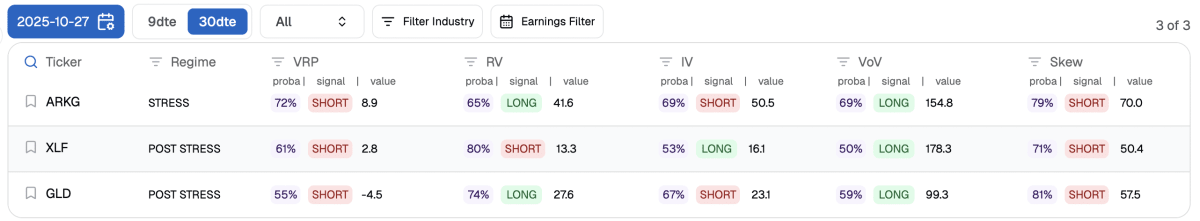
That filtering process removes 90% of the market noise before we even start thinking about trades. Our dashboards measure hundreds of such probabilities every day — across maturities, sectors, and volatility structures. We look at things like VRP, skew differentials, and forward-vol z-scores not as opinions but as conditional distributions: “Under these conditions, what tends to happen next?”
That is what it means to operate probabilistically. You no longer “like” or “dislike” a setup — it either clears the statistical bar or it doesn’t.
Most traders confuse filtering with prediction. It’s not the same. Filtering is the discipline of not acting when odds are poor. It’s the foundation of expectancy.
When we talk about edge at Sharpe Two, it’s not about being right — it’s about knowing when the market gives you a measurable tailwind.
If that tailwind isn’t there, we don’t trade. This is the logic professional desks use implicitly: quantifying opportunity before committing capital. Our goal is to make that process explicit and accessible. To give traders a framework where discipline isn’t about willpower, but math.
Filtering noise doesn’t make you slower; it makes you scalable.