When traders talk about volatility, they almost always mean implied volatility. And it makes sense: implied vol is the price of uncertainty, the heartbeat of the options market. Most frameworks revolve around whether this number is high or low, and two metrics dominate retail conversation: IV Rank and IV Percentile.
They have their uses. They tell you where implied volatility sits relative to its own past. If IV Rank is 90, implied volatility today is higher than 90 percent of the last year; if it is 10, it is unusually cheap.
This is not pointless. It is a decent first approximation of regime. But in a market where competition intensifies every year, decent is rarely good enough. The real question is no longer where IV is but how unstable is volatility itself.
Anyone who has ever been run over by a volatility spike knows the pain does not come from the level of implied volatility but from how violently it can change.
To understand that, we need to revisit the lesser-appreciated cousin of implied volatility: realized volatility. And then use it as a bridge toward something much more important: the volatility of implied volatility, often shortened to vol-of-vol.

Realized Volatility: The Foundation of Every Volatility Regime
Realized volatility is a purely descriptive number. It tells you how much the underlying actually moved over a recent window, ignoring direction and retaining only variability.
Take two recent periods for the same asset. One shows tiny daily returns clustered around zero; the other looks like a seismograph. You need no formula to sense which period had higher realized volatility.

Behind the scenes is a straightforward transformation of the return series, but the key point is this: realized volatility is backward-looking. It does not try to predict anything. It simply describes the state of the world.
Realized volatility has one magical property: it clusters. Quiet periods remain quiet. Agitated periods stay agitated. Eventually things revert; there is a gravitational pull toward a long-run average but you rarely jump from calm to chaos to calm in a single step.

This clustering is why realized volatility is so central to risk management. Most institutional investors size positions, rebalance exposures, and control drawdowns based on realized volatility, not implied. They treat RV as the ruler of risk.
How Implied Volatility Mirrors Market Stress
Now consider implied volatility (IV). In theory, IV is forward-looking: it reflects the market’s expectation of future variability. It is a tradable commodity and in practice behaves like a sibling of realized volatility: it spikes abruptly, then stays elevated for a while, then slowly bleeds lower, and eventually drifts back toward “normal.”
In other words, implied volatility clusters too.

This should not surprise us. Implied volatility is set by human beings (and algorithms coded by human beings) reacting to the same environment that produced realized volatility.
So if both realized and implied volatility exhibit regimes, a natural question emerges: if volatility clusters, does the rate at which volatility moves also cluster?
Vol-of-Vol Explained: The Market Instability Metric Traders Ignore
Imagine you compute the return of implied volatility in the same way you compute the return of a stock: today’s IV vs. yesterday’s IV. Do this for a long series and you will see the same phenomenon emerge: vol-of-vol clusters too.
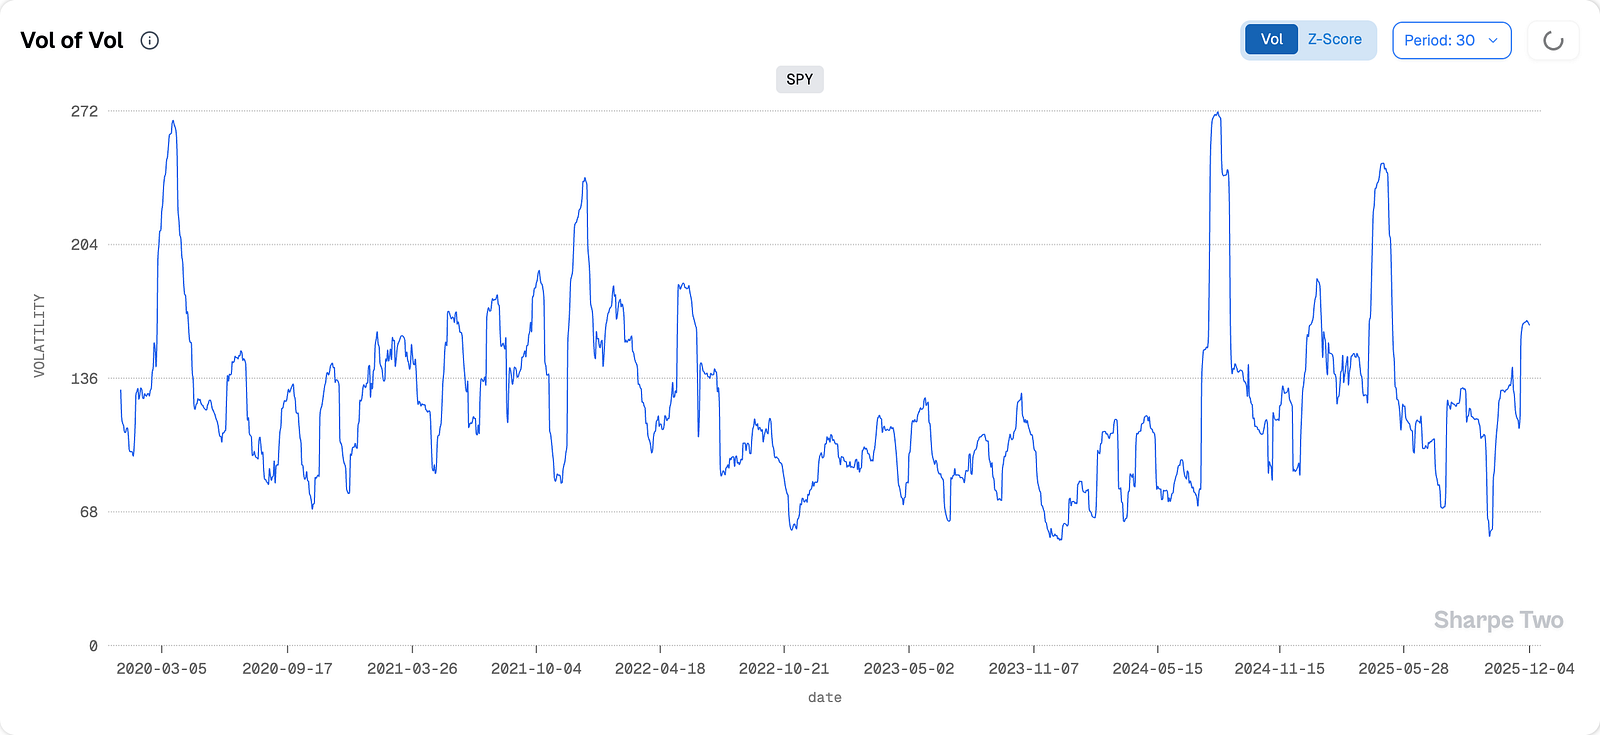
Sometimes the volatility surface is calm; implied vol drifts gently, nothing dramatic. Other times the surface is erratic, with IV snapping higher or lower in a matter of hours. This instability is often the main source of pain for volatility traders.
- When vol-of-vol is low, implied volatility tends to fade methodically.
- When vol-of-vol is high, implied volatility behaves like a nervous animal: it jumps, retreats, jumps again, overshoots, and generally refuses to stay still.
This is why trying to catch the top during a volatility spike is such a dangerous game. Tops are not stable structures. When vol-of-vol is elevated, what looks like a top may easily become the foothill of a larger move.
This is the nuance IV Rank can never capture. That metric says: vol is high compared to the past. But if vol-of-vol is high, vol may go higher with zero warning.
Vol-of-Vol: The Stability Signal That Separates Safe Trades from Landmines
Retail traders often stare at a high IV Rank and think: “options are expensive; I should sell.” Institutional traders look at the same chart and ask a much deeper question: “how unstable is this?”
Consider the analogy of a storm system. A tall storm cloud means bad weather. But a fast-moving, unpredictable storm line is worse; it can change direction, intensify, and rupture much faster than anyone forecasts.
High IV without high vol-of-vol is a tall storm cloud. High IV with high vol-of-vol is a tornado: lightning speed and a very unpredictable path.
Vol-of-vol is essentially the measure of how violent the volatility surface is right now. It tells you whether the market is pricing uncertainty calmly… or hysterically.
This nuance is crucial because most short-volatility strategies blow up not when IV is high, but when the rate of change in IV accelerates.
Once you see that volatility itself has regimes you can classify market conditions along two axes:
- Level of implied volatility (IV): high vs. low
- Stability of implied volatility (vol-of-vol): high vs. low
This yields a simple two-by-two map of the volatility landscape.
1. Low IV + Low Vol-of-Vol: Best environment for selling volatility.
Quiet market, stable surface, mean-reverting conditions. You can size larger, be systematic, and expect a predictable decay profile. This is where the bulk of long-run PnL comes from for systematic vol sellers.
2. High IV + Low Vol-of-Vol: Selective opportunity, but proceed with discipline.
Vol is elevated (perhaps due to a recent shock) but the surface has stopped shaking. This is where contrarian vol sellers get their best risk-adjusted entries. The stress event is likely maturing; reversion odds rise; risk is visible and stable.
3. Low IV + High Vol-of-Vol: The trap.
This environment looks calm, but the volatility surface is jittery. It is the equivalent of walking on ice: the ground appears smooth, but it is unstable underneath. Shorting vol here is more dangerous than IV Rank suggests. Many traders get complacent in these regimes because the spot index looks fine, but the surface tells a different story.
4. High IV + High Vol-of-Vol: Avoid. Just avoid.
This is the classic “don’t be a hero” quadrant. Implied vol is high, but the surface is wildly unstable. Tops are unreliable; reversals are messy; gamma hedging is expensive; margins widen; liquidity vanishes.
If you insist on selling vol here, you are not trading you are gambling and hoping every goes your way.
This is also where retail accounts experience margin calls, forced liquidations, and the kind of losses that take years to repair.
The beauty of this matrix is that it captures something traders feel intuitively but rarely articulate: volatility trades often fail because you ignored the instability of volatility.
By elevating vol-of-vol to the same level of importance as implied vol itself, you begin to trade not just the surface… but the structure behind it.
Final Thoughts
Volatility trading is often simplified into sell when IV is high, buy when IV is low. That idea is neat, intuitive but incomplete.
A far more robust framework emerges when you treat volatility like any other time series with regimes and vol-of-vol is often akey that unlocks this view.
Not all volatility is created equal and not all spikes are opportunities.
But once you start watching vol-of-vol, the difference becomes obvious.