research · Oct 8, 2026 · 8 min read
Trading volatility over elections

Last Sunday saw Flávio Bolsonaro finish ahead of Lula in the first round of the Brazilian presidential election, with the two now heading into a runoff. The market reacted with a gigantic move: in our data, EWZ was up 13.67% by 09:35 ET on Monday.
Needless to say, if you were short the straddle ahead of the event, you would have suffered.
There is an element of variance in every option trade. Every time you put the trade on, you know something can derail your plan, and what seemed like a comfortable position can end up way outside its expected range because of the path or the jump taken by the underlying. That is part of the option trader's journey, and you'd better be comfortable with it sooner rather than later.
We can also do our due diligence and examine how markets react around elections. In this article, we look at 20 completed election cycles since 2018, plus the current Brazilian first round: 27 rounds across nine countries, including the UK, France, Mexico, the US and, obviously, Brazil.
The well known volatility crush effect
Trading volatility over an election is not much different from trading it over earnings for a stock. Ahead of the event, implied volatility can rise as market participants hedge against either scenario, up or down, often associated with the arrival of one political leader or another in power.
Our data show a sharp post-election volatility crush. At 7-day constant maturity, the median next-day decline is 11 volatility points. At 30-day constant maturity, the median crush is 3.34 points, with IV falling in 19 of 22 observations.
Here is the same computation across the three measures. Each cell shows the median / average decline, in volatility points.
IV measureNext-session closeWithin seven calendar days7-day constant maturity10.98 / 16.0119.90 / 21.3130-day constant maturity3.34 / 3.193.24 / 3.87First available variance-swap expiry5.95 / 10.656.52 / 14.32
The study covers 27 election rounds. Maturity coverage gives us 11 / 9 next-day / week pairs for 7-day IV, 22 / 21 for 30-day IV, and 26 / 25 for the first available variance expiry. That last measure follows the nearest valid expiry in our data at each observation, rolling to another contract as needed.
The intuition is familiar: once uncertainty is removed, some of that expensive insurance is no longer needed, and implied volatility comes down. We see the same kind of repricing around earnings and other corporate announcements.
Selling a straddle is an obvious way to target that volatility crush. The catch is the move in the underlying—and whether elections repeatedly expose the same weakness in the trade.
Across these 27 events, the short straddle loses $446 by the next-session close, using quoted midpoints and $10,000 of underlying notional per event. The biggest losses by the next close come from Mexico 2024, Argentina's 2023 runoff and Brazil's 2026 first round. Brazil 2026 is the worst at our 09:35 observation, losing about $644 on that same scale.
It goes without saying that we should normalize the positions to compare them. Here we use the same underlying notional throughout, which also lets us compare the straddle with a put and a risk reversal later on.
Capturing the election premium is about more than waiting for IV to fall. We need a structure that also works with the market's reaction.
Stocks go up over elections
The dominant reaction across these elections is an upward move in stocks. In that sense, what happened in Brazil was not unusual. The sheer size of the movement was: it completely overwhelmed the premium collected by the straddle.
Out of the 27 events we have on record, 17 see an uptick by the next-session close, or 63%. The average ETF price return is +1.04%, with a median of +0.64%.
Our explanation starts with put hedging: investors build up downside protection ahead of the vote. As the result arrives, those hedges unwind and volatility falls. This change can provide the familiar tailwind associated with vanna, helping the underlying move higher.
Skew gives us a direct view of how the two option wings are priced. Our model-free skew index brings the prices of out-of-the-money puts and calls across the available strikes into one reading for each expiry.
We weight those prices by strike and strike spacing, add up the put and call contributions separately, and adjust for time to expiry. The raw measure is the put contribution minus the call contribution, with a forward-price adjustment. We then take its cube root, keeping the sign, and multiply by 100 to express it as an index.
Reading it is straightforward: positive means put-heavy, negative means call-heavy, after the forward adjustment. Closer to zero means a more balanced pricing of the two wings. For example, a move from +30 to +20 is a 10-point decline and a move towards balance. A move from −20 to −30 is also a decline, but moves further away from zero. We therefore track both the change in the index and how often it moves closer to zero. The unit is skew-index points.
For 7-day and 30-day constant maturity, we use an exact matching expiry where available, or interpolate the time-weighted raw measure between expiries bracketing the target before converting it into the index. This keeps the horizon consistent from one observation to the next.
Here is the median / average decline in index points:
Skew measureNext-session closeWithin seven calendar days7-day constant maturity5.59 / 1.9814.18 / 17.6430-day constant maturity0.68 / 0.206.81 / 2.84First available skew-swap expiry7.33 / 9.602.69 / 7.36
Read each pair as median / average: the 7-day next-session figure of 5.59 / 1.98 means the typical decline was 5.59 index points and the average decline was 1.98. Positive figures in this table mean the index fell after the election.
The usable pair counts are the same as in the IV table. The first available skew expiry is also reselected at each observation.
The 30-day skew index moves closer to zero in 15 of 22 next-day observations; the first available expiry does so in 17 of 26. At 7 days, that happens in 6 of 11 observations. The index moves towards balance most consistently at 30 days and in the first available expiry: the put-call imbalance contracts after the election in most observations. That repricing is part of what we want to capture.
Attempt at improving the strategy
We have two features to work with: falling IV and equities rising more often than falling. Let's structure the trade around both, with a short put or… a risk reversal.
Selling the put keeps the premium on the downside without adding a short call that hurts when the market rallies. A bullish risk reversal takes that idea further: sell an out-of-the-money put and buy an out-of-the-money call.
For this comparison, we use puts and calls selected close to 25 delta at entry. Each strategy uses the same expiry for a given event, and we keep its strikes fixed through the trade. Every leg is sized to $10,000 of underlying notional.
Here is the cumulative performance at quoted midpoints:
StrategyNext-session close, 27 eventsWithin seven calendar days, 26 eventsShort ATM straddle−$446−$488Short 25-delta put+$973+$2,510Bullish 25-delta risk reversal+$1,143+$3,352
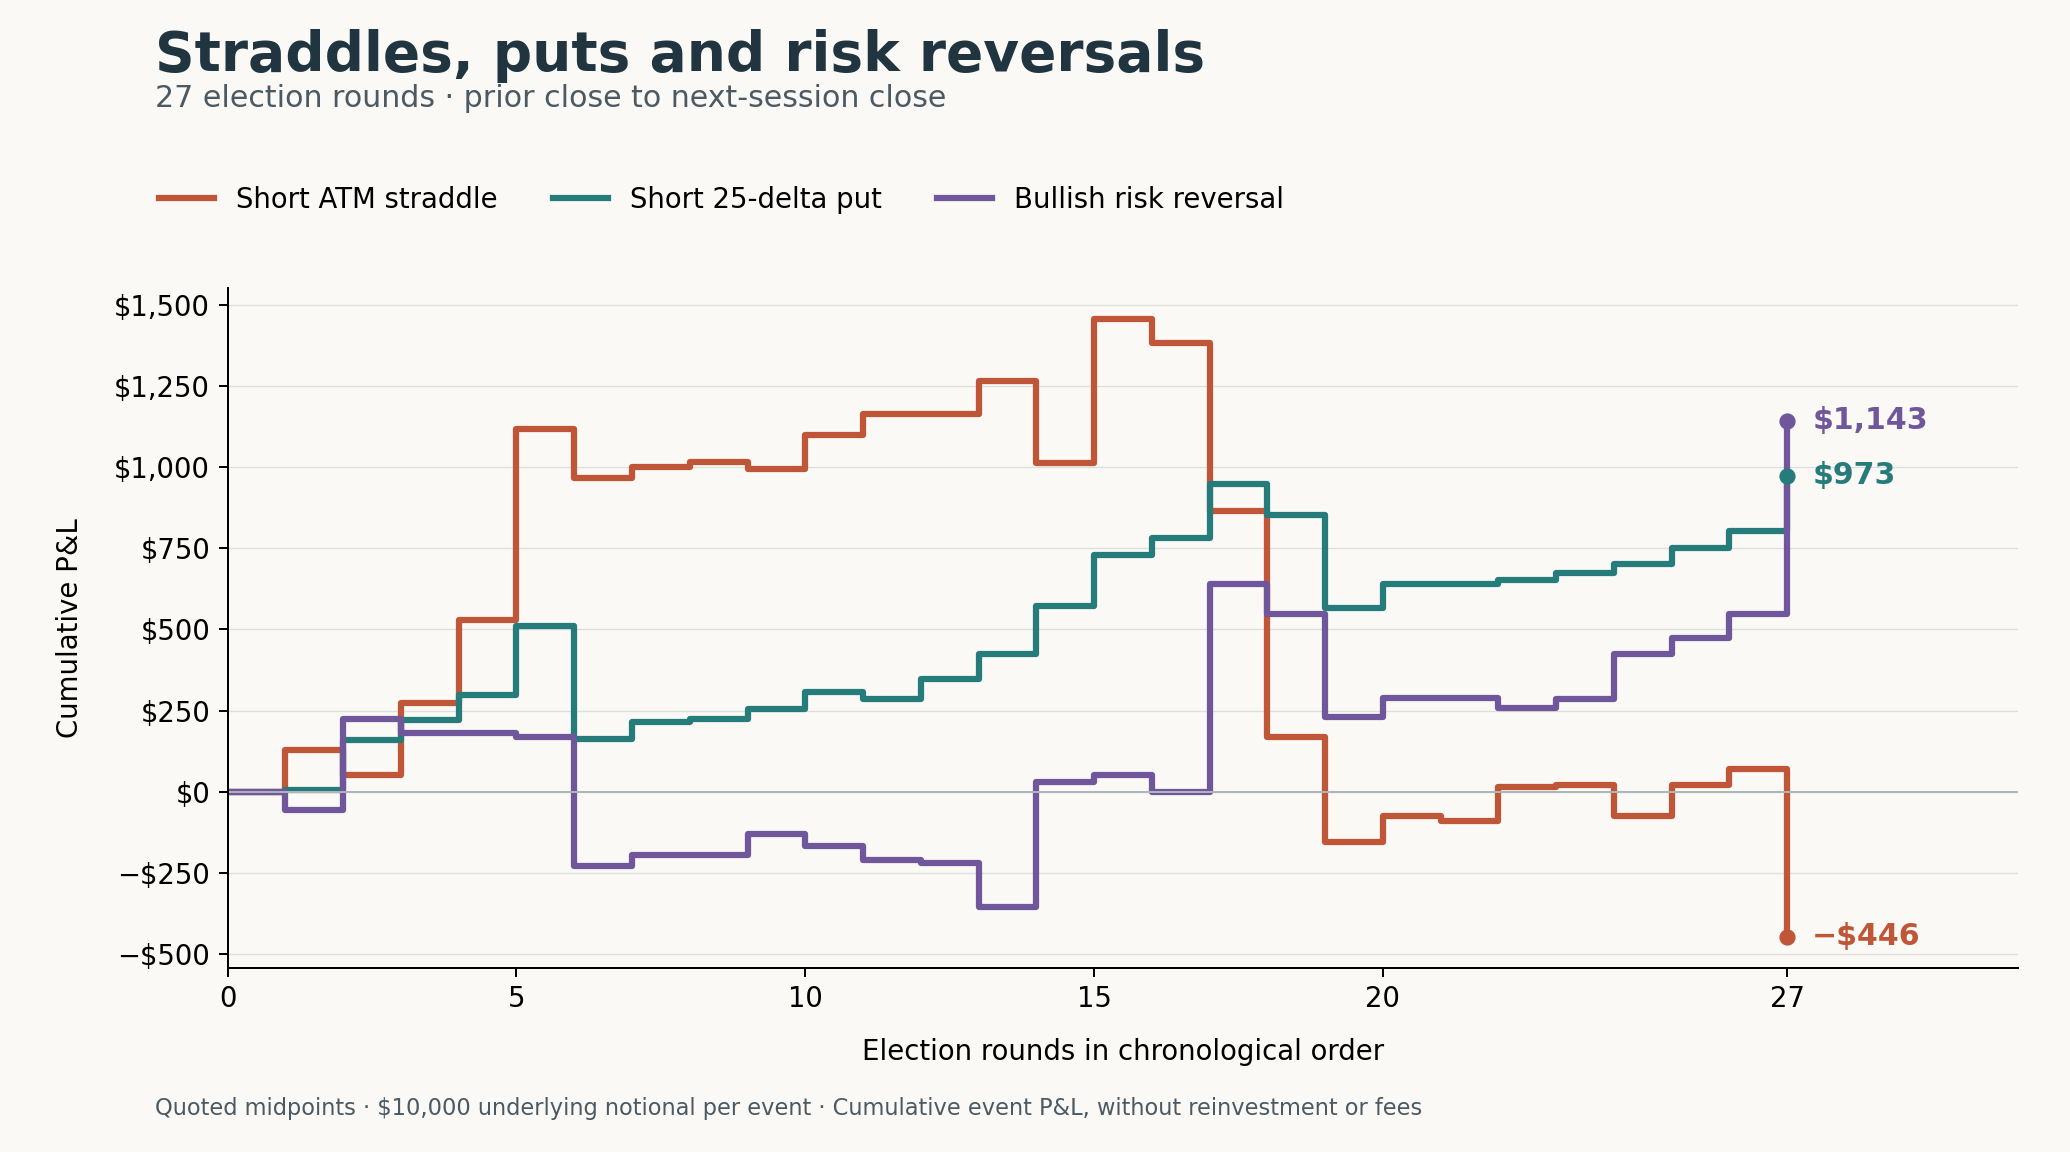
The next-day result follows the order we had in mind: the straddle loses money, the short put improves the outcome, and the risk reversal finishes ahead of both. The separation is larger over the week.
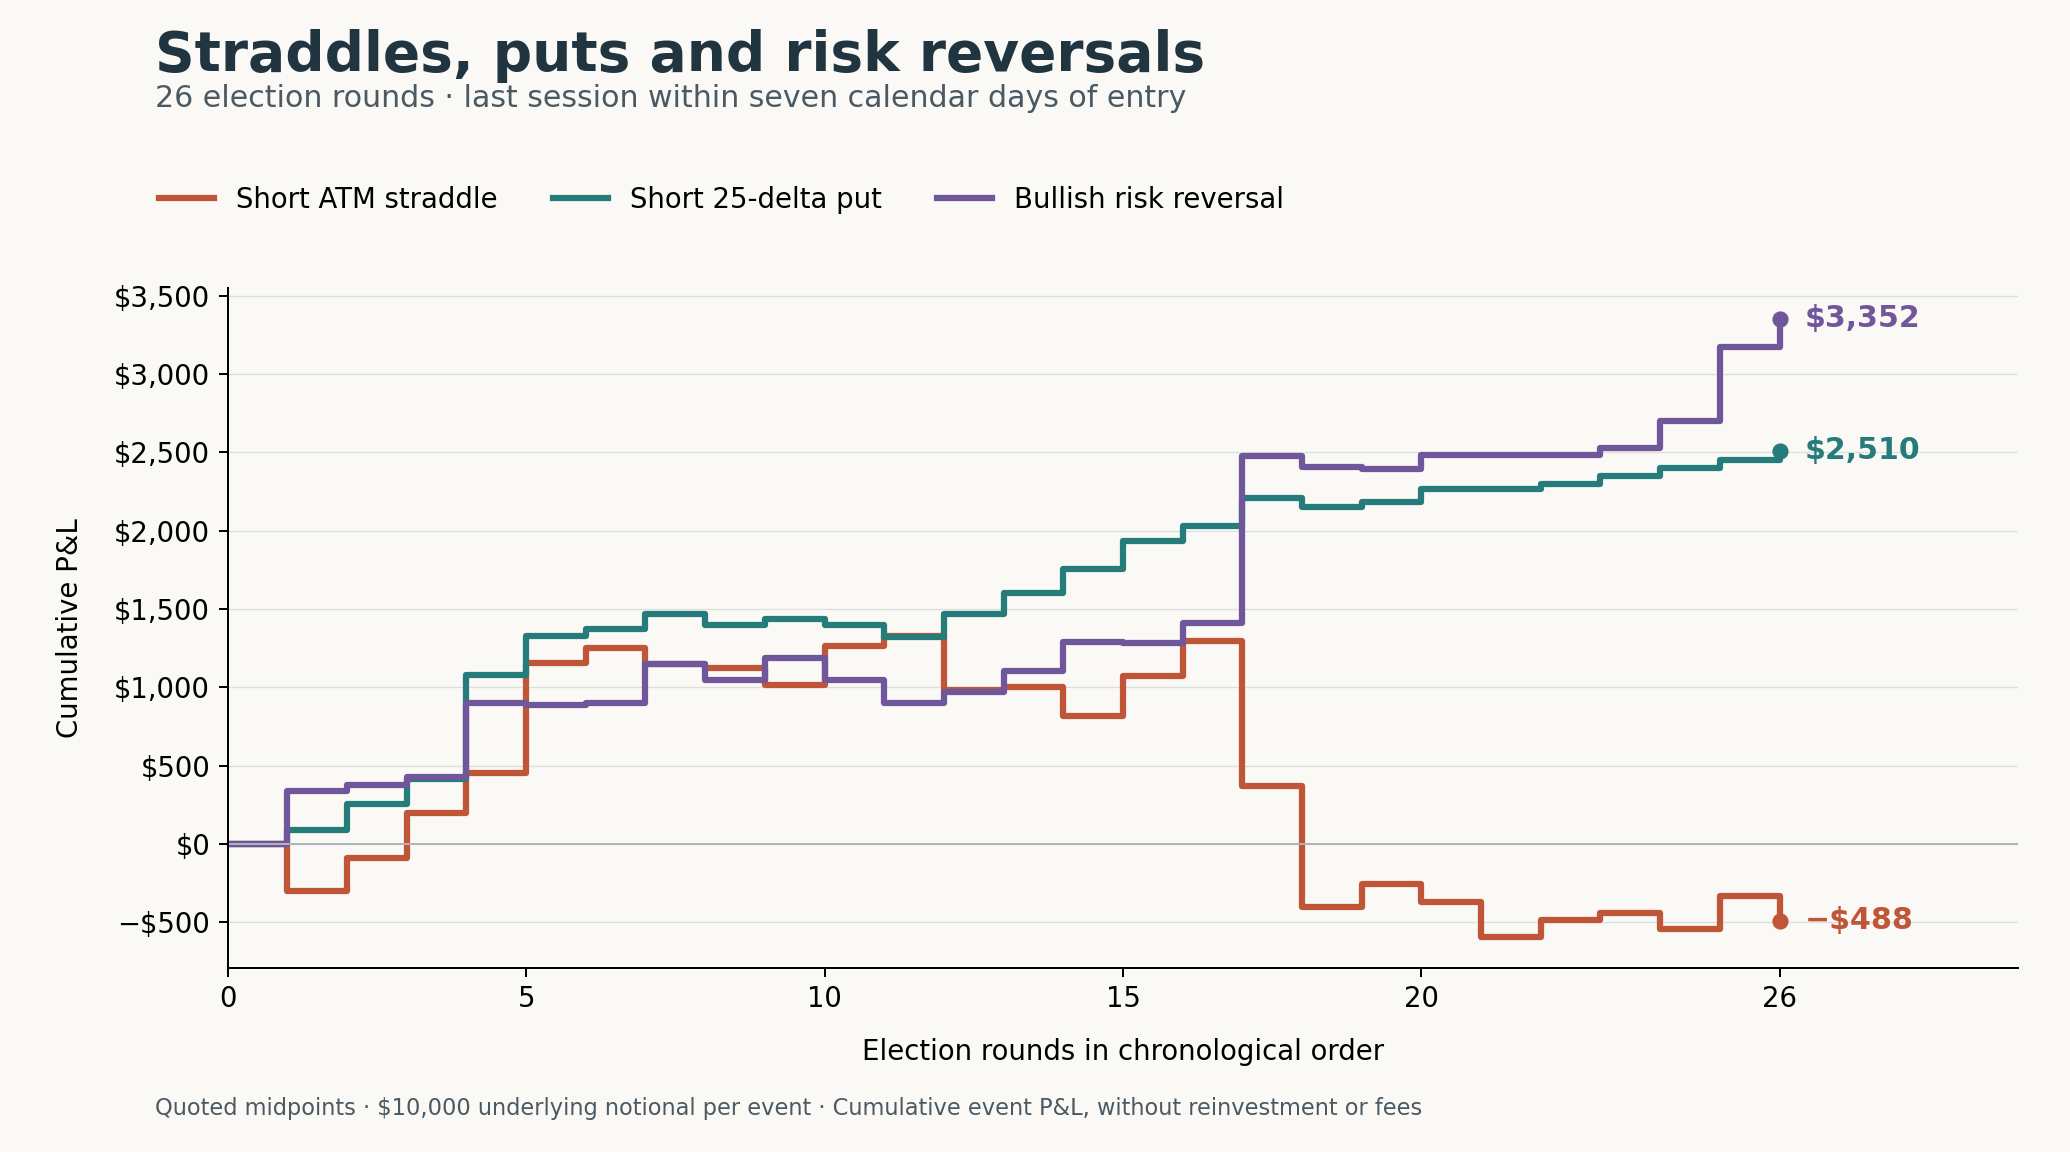
The comparison shows why trade structure matters. A volatility crush can happen exactly as expected, while the short straddle still loses because the underlying moves too far. Selling the put changes the exposure; adding the long call lets the risk reversal participate further in the upside.
Keeping the short put and giving ourselves room on the upside produces a much better outcome across these trades. The trade targets the election premium while leaving room for the market to rally.
Data through 6 October 2026. “Next day” means the next trading session's close; the week endpoint is the last close within seven calendar days of entry. Brazil's 2026 week was not yet complete. Week trades use an expiry that survives their exit and can differ from the overnight contract. Curves show cumulative event P&L at quoted midpoints, with fixed notional, no reinvestment and no trading costs.
Try it with our data
Put the data to work on the events you trade. Try Sharpe Two's Active plan for 14 days for $14. Explore our volatility data and analytics, compare maturities, and build your own analysis of the trades that matter to you.
Start your 14-day trial for $14. Cancel anytime during the trial; if you continue, your account moves to the Retail plan.
Discussion
0 COMMENTSLog in to join the discussion.