research · Oct 15, 2026 · 9 min read
The 25% Rule: Smart Harvesting or Leaving Money Behind?

At Sharpe Two, we are known for taking profit at 25% of the credit received, and we get a fair amount of valid criticism for it. The strongest argument against the rule is simple: if the trade still has an edge, why on earth would you get out?
Take our recent TLT trade. During the bond-market sell-off, implied volatility jumped, and our signal list showed an opportunity to sell a roughly 20-delta strangle. Our October 1 Signal du Jour used the November 6 74.5 put and 81 call. With 36 days to expiration, the indicative midpoint credit was $1.12.
Our model put the likelihood that the implied volatility we sold would exceed the realized volatility that followed at 77%. By our standards, that is a very high score.
The trade then did exactly what we wanted. By October 5, it had reached our 25% target: a buyback price of $0.84 against the original $1.12 credit. But by the October 13 close, the strangle was worth $0.39 at the midpoint. As we discussed in our October 14 Trade Anatomy, there was a lot more premium left to collect.
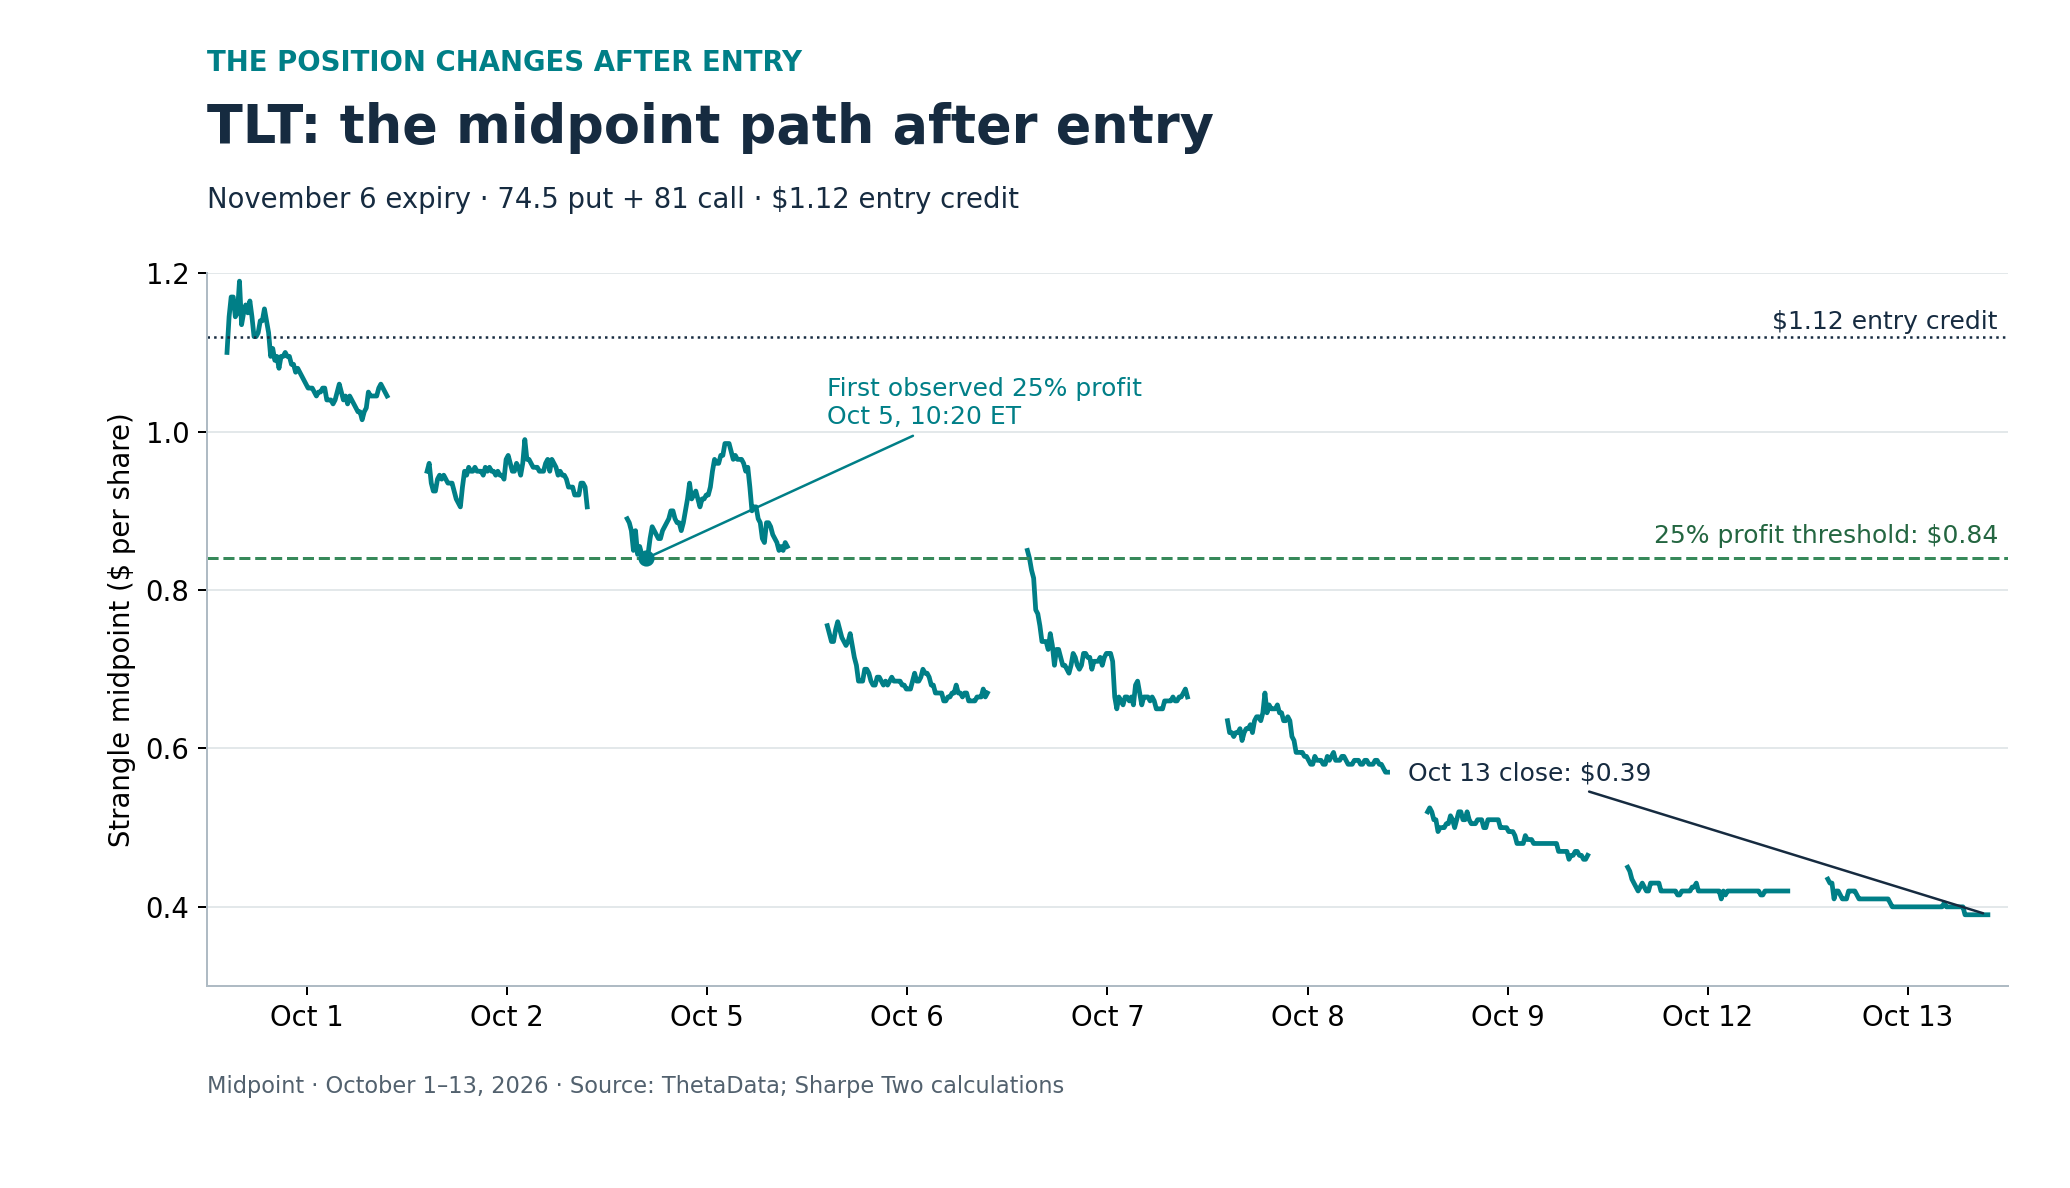
TLT November 6 74.5 put / 81 call, October 1–13, 2026. Entry credit $1.12; 25% profit target $0.84; October 13 closing midpoint $0.39.
The opposite experience is just as familiar. How many times have you read about a trader who stayed in a little longer, then woke up the next morning in horror to find the entire profit gone?
So why 25%? Why not 50%, or even 10%?
Before we get to the exit, let's start with what matters more: the entry.
Waiting for the sake of waiting is not a strategy
Theta without an edge is an illusion. If you sell options just because they have a big theta, you are a sitting duck, waiting for variance to strike.
A large theta tells us how fast time decay is working. It does not tell us whether we are being paid enough for the risk. Before deciding how long to stay in a trade, we need a reason to be in it.
Here is the starting point: sell straddles across ETFs with 35–42 days to expiration, without using our signals, and close them when they reach 21 days to expiration. TLT was a strangle; these comparisons use straddles. Each trade starts with $1,000 of premium received.
That is what our signals are for. We want to sell when our model sees a strong likelihood that implied volatility will exceed the realized volatility that follows.
So now we select entries only when our 30-day signal is SHORT and its probability is at least 66%, and keep the same exit at 21 days to expiration. The chart compares selling indiscriminately with waiting for those odds.
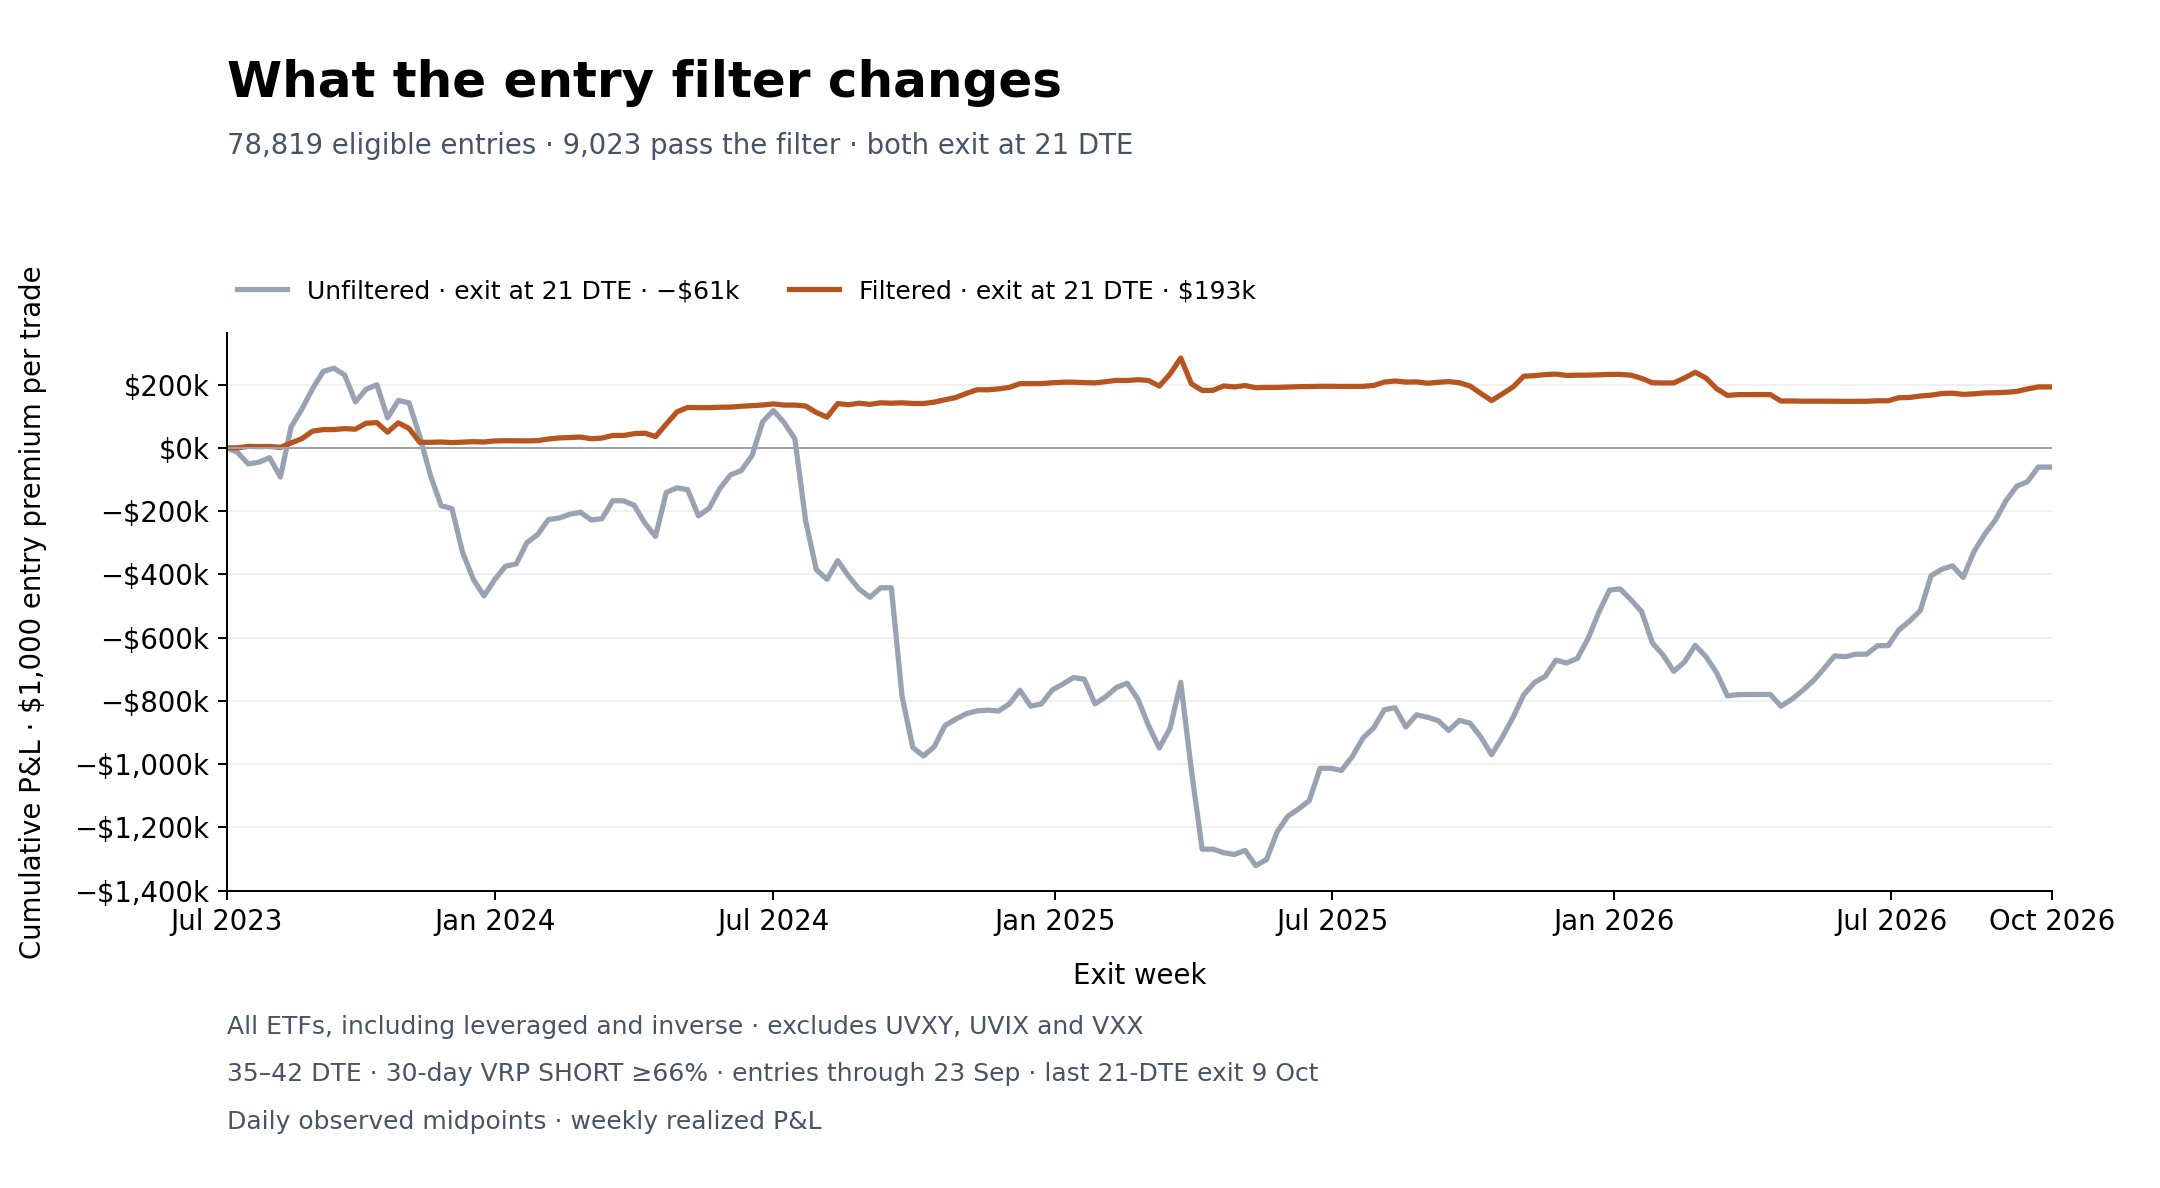
Entries July 3, 2023–September 23, 2026; results through October 14, 2026. ETF straddles entered at 35–42 DTE; both strategies exit at 21 DTE. Signal-selected: 30-day SHORT probability ≥ 66%. Cumulative trade P&L at midpoints; $1,000 entry premium per trade.
The unfiltered strategy ends with a cumulative loss of $60,844. With the same exit rule, the selected trades produce $192,775 of cumulative profit. Selling premium was not enough on its own. What mattered was which trades we chose to enter.
To bring the same entry discipline to our own trades, we can see current volatility signals on the platform and use its volatility surface analysis to assess the edge before we sell. Choose your platform plan.
How much do we leave on the table?
Once we have selected the entries, we can ask a narrower question: what happens when we change only the exit?
We take the same 9,023 signal-selected entries and compare three rules. The first holds for 14 calendar days. The second holds for 21 calendar days. The third takes profit at 25% of the credit received, with a 14-day maximum. That last rule is our standard Sharpe Two approach. On $1,000 of entry premium, the profit target is $250. A 21-day hold is not the same as the 21 DTE exit above: one counts days since entry, the other counts days left to expiration.
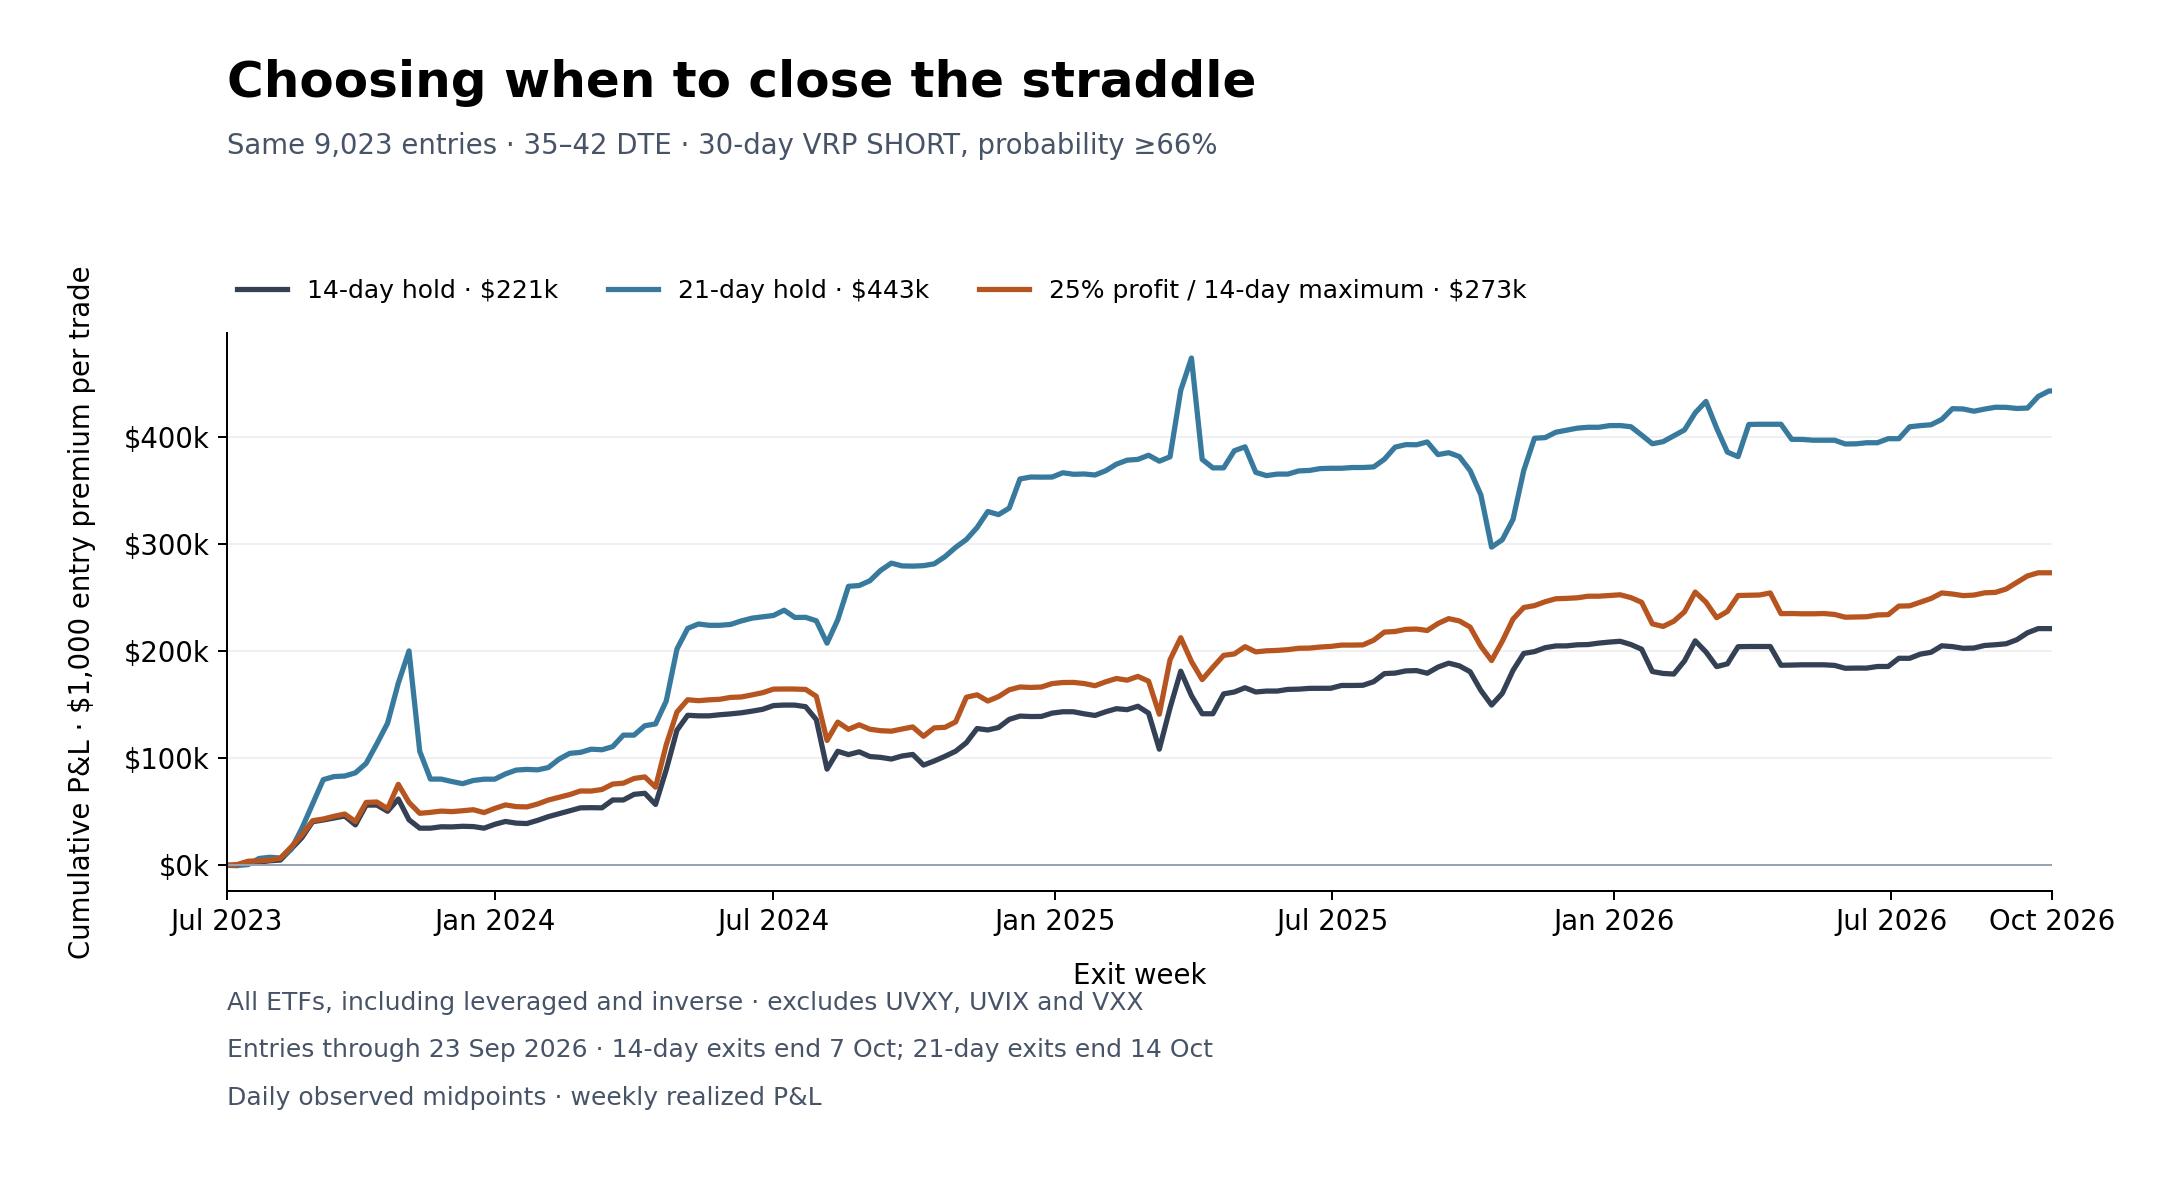
Entries July 5, 2023–September 23, 2026; results through October 14, 2026; same 9,023 trades. Exits: 14 days, 21 days, or first observed 25% profit with a 14-day maximum. Cumulative trade P&L at midpoints; $1,000 entry premium per trade.
The 21-day hold produces $443,103 of cumulative profit, the most of the three. The 25% target with a 14-day maximum produces $273,288. The simple 14-day hold produces $221,147.
Compare the 25% target with the fixed 21-day hold first. The target gives up some profit, but its weekly realised P&L varies about 40% less. Its largest peak-to-trough drawdown is about $48,100, against $176,600 for the fixed 21-day hold.
Now compare it with the simple 14-day hold. Both exit within two weeks, but the 25% target earns about $52,100 more, with a smaller drawdown. That is what looking for an early exit buys us: a smoother path than holding for three weeks, plus more profit and a smaller drawdown than simply holding for two.
We do not delta-hedge these positions. If we give a trade another week, we also carry whatever directional exposure it has picked up as the market moved. So we have two things to decide: whether there is more premium left to collect, and whether we still want the position we now hold.
The TLT example shows how tempting it is to stay. Once you have seen the rest of the move, the early exit looks unnecessary. But when you hit the target, you have not seen the rest of the move yet. The useful question is whether you still want the position you are holding.
What if we make the checkpoint depend on the edge?
We can take the same idea one step further. Instead of closing just because profit reaches 25%, we close only when two things are true at the same check: profit is at least 25%, and the current 30-day short-vol probability is 63% or less. If the edge still looks strong, we keep the position. We close at the first check where both conditions hold, or when we reach the holding limit.
We test this checkpoint with a 14-day maximum and with a 21-day maximum, using the same 9,023 entries.
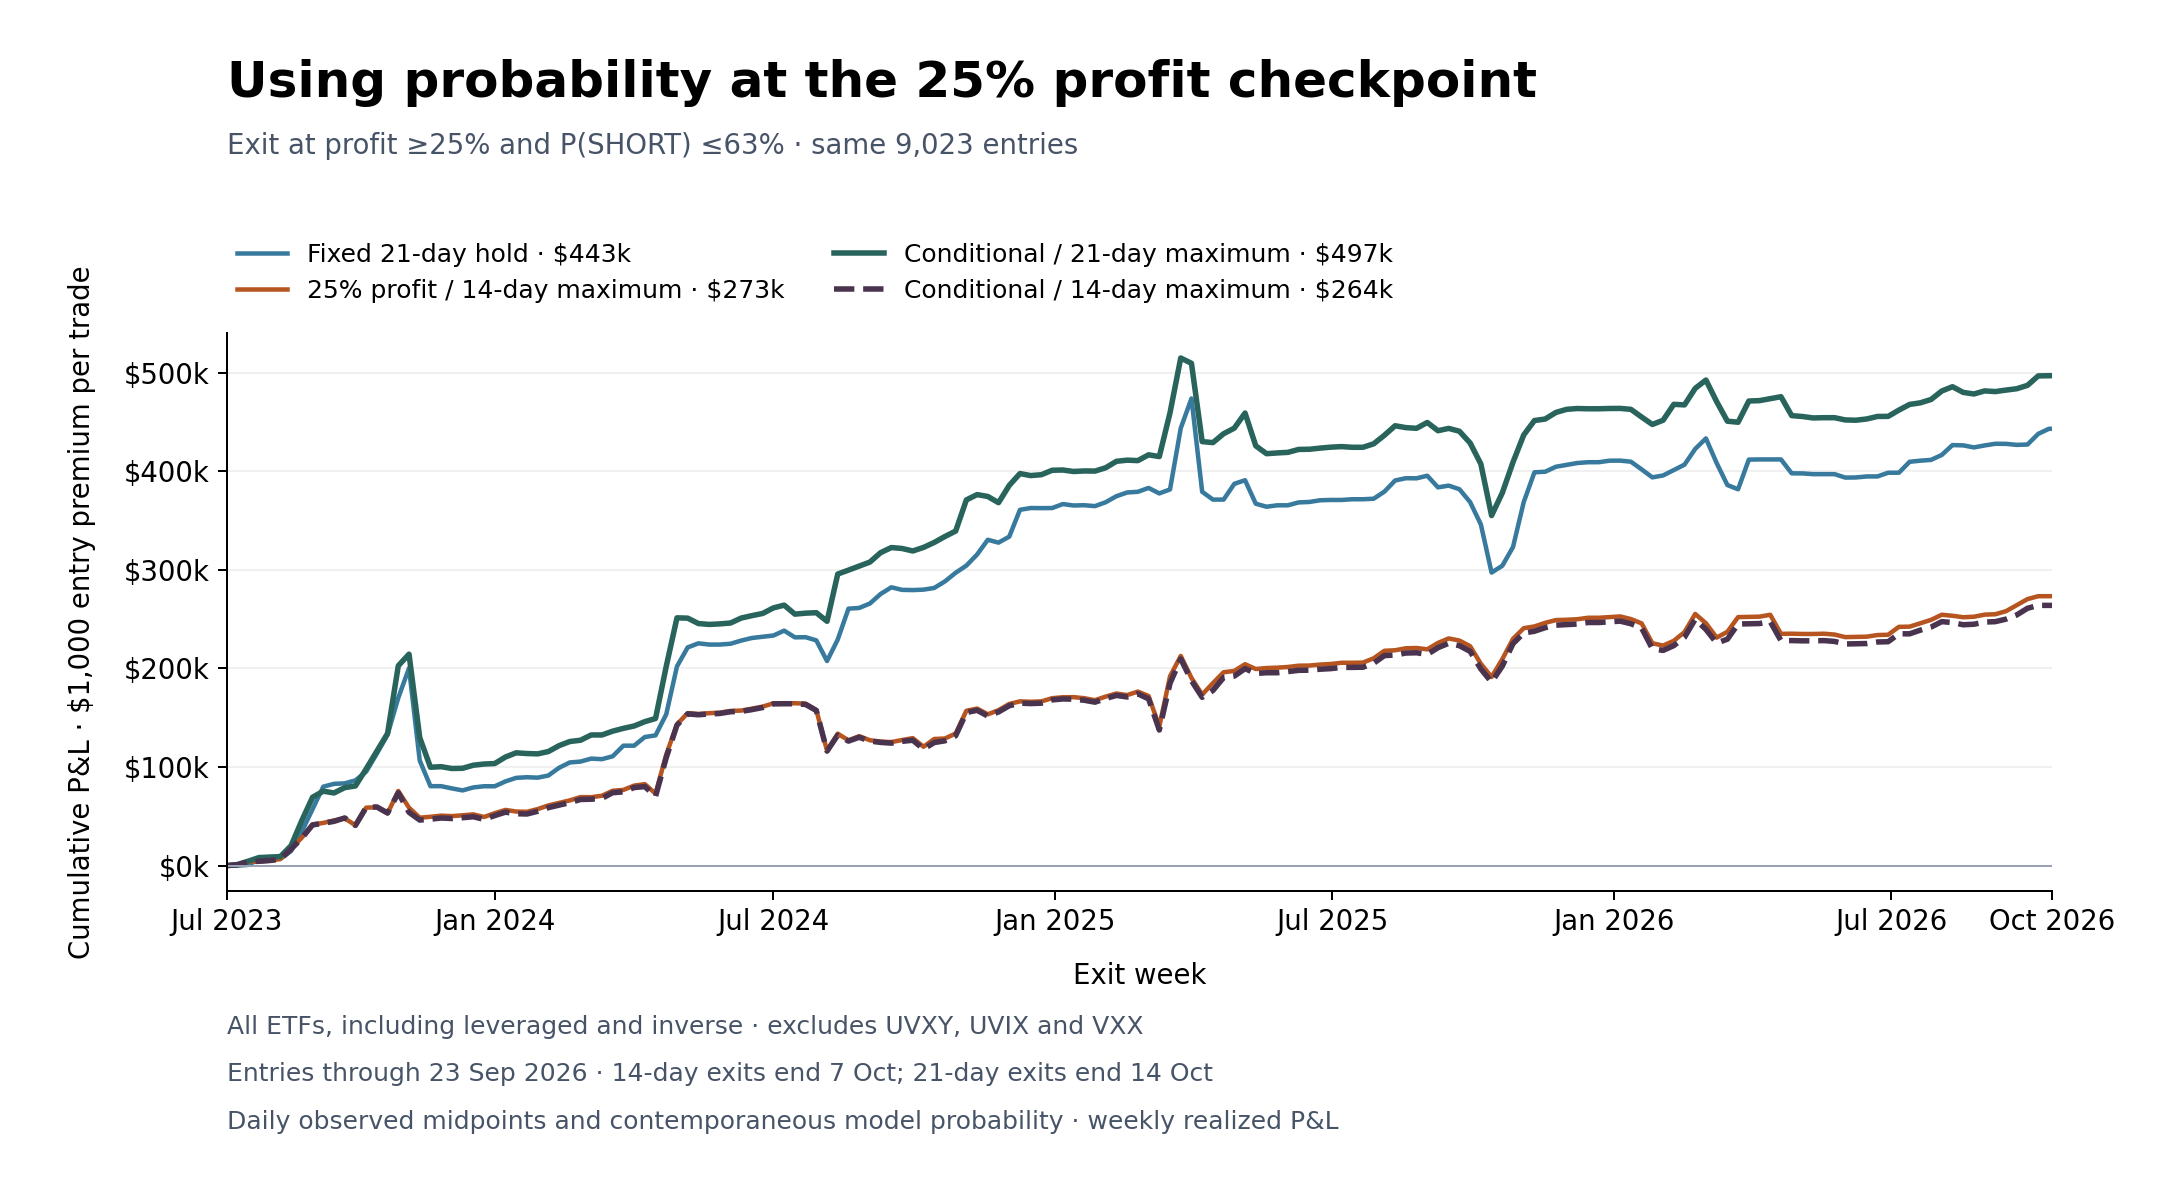
Entries July 5, 2023–September 23, 2026; results through October 14, 2026; same 9,023 trades. Conditional exits require at least 25% profit and a current 30-day short-vol probability ≤ 63%, with a 14-day or 21-day maximum. Cumulative realised trade P&L; $1,000 entry premium per trade; midpoint prices.
With the two-week maximum, the conditional rule produces $263,974. That is more than the simple 14-day hold's $221,147, but less than the automatic 25% exit's $273,288.
With the three-week maximum, compare the conditional rule with the fixed 21-day hold. It produces $496,963, about $53,900 more than the fixed 21-day hold's $443,103. Its largest drawdown is also smaller, about $159,800 against $176,600. Weekly realised P&L varies by a similar amount under both, slightly more under the conditional rule. Against a plain 21-day hold, checking the edge adds profit and trims the largest setback without materially changing the weekly swings.
To test conditional exits like this in your own research, explore the Sharpe Two API.
The practical question at 25% is whether the position still deserves its place in our book.
The 25% rule is an occasion to decide whether we still want the position
In our Discord trading group, we are not dogmatic about the 25% rule. We use it as a guideline: a point in the life of the trade that we do not want to miss.
Once a trade is on, market conditions keep moving. You may have sold implied volatility at 20% that now sits at 18%. You may have entered roughly delta-neutral and now hold something fairly unbalanced after picking up delta as the market moved.
And the most obvious change of all: time has passed.
A position entered at 36 DTE is at 28 DTE eight days later, and at 21 DTE a week after that. Even if our view on volatility has not changed, the position reacts differently to market moves as expiration approaches.
That is why you rarely see us enter at 30 DTE. We tend to start further out, around 36–42 DTE, and our usual holding window is two weeks.
We often express our views with 20-delta strangles, and we do not delta-hedge them. By the time we have collected 25% of the premium, the market has probably moved, so the position is unlikely to still be delta-neutral. If we still want to express a view on volatility, we may prefer to recenter the trade so that it does not carry a directional bet we never intended to make.
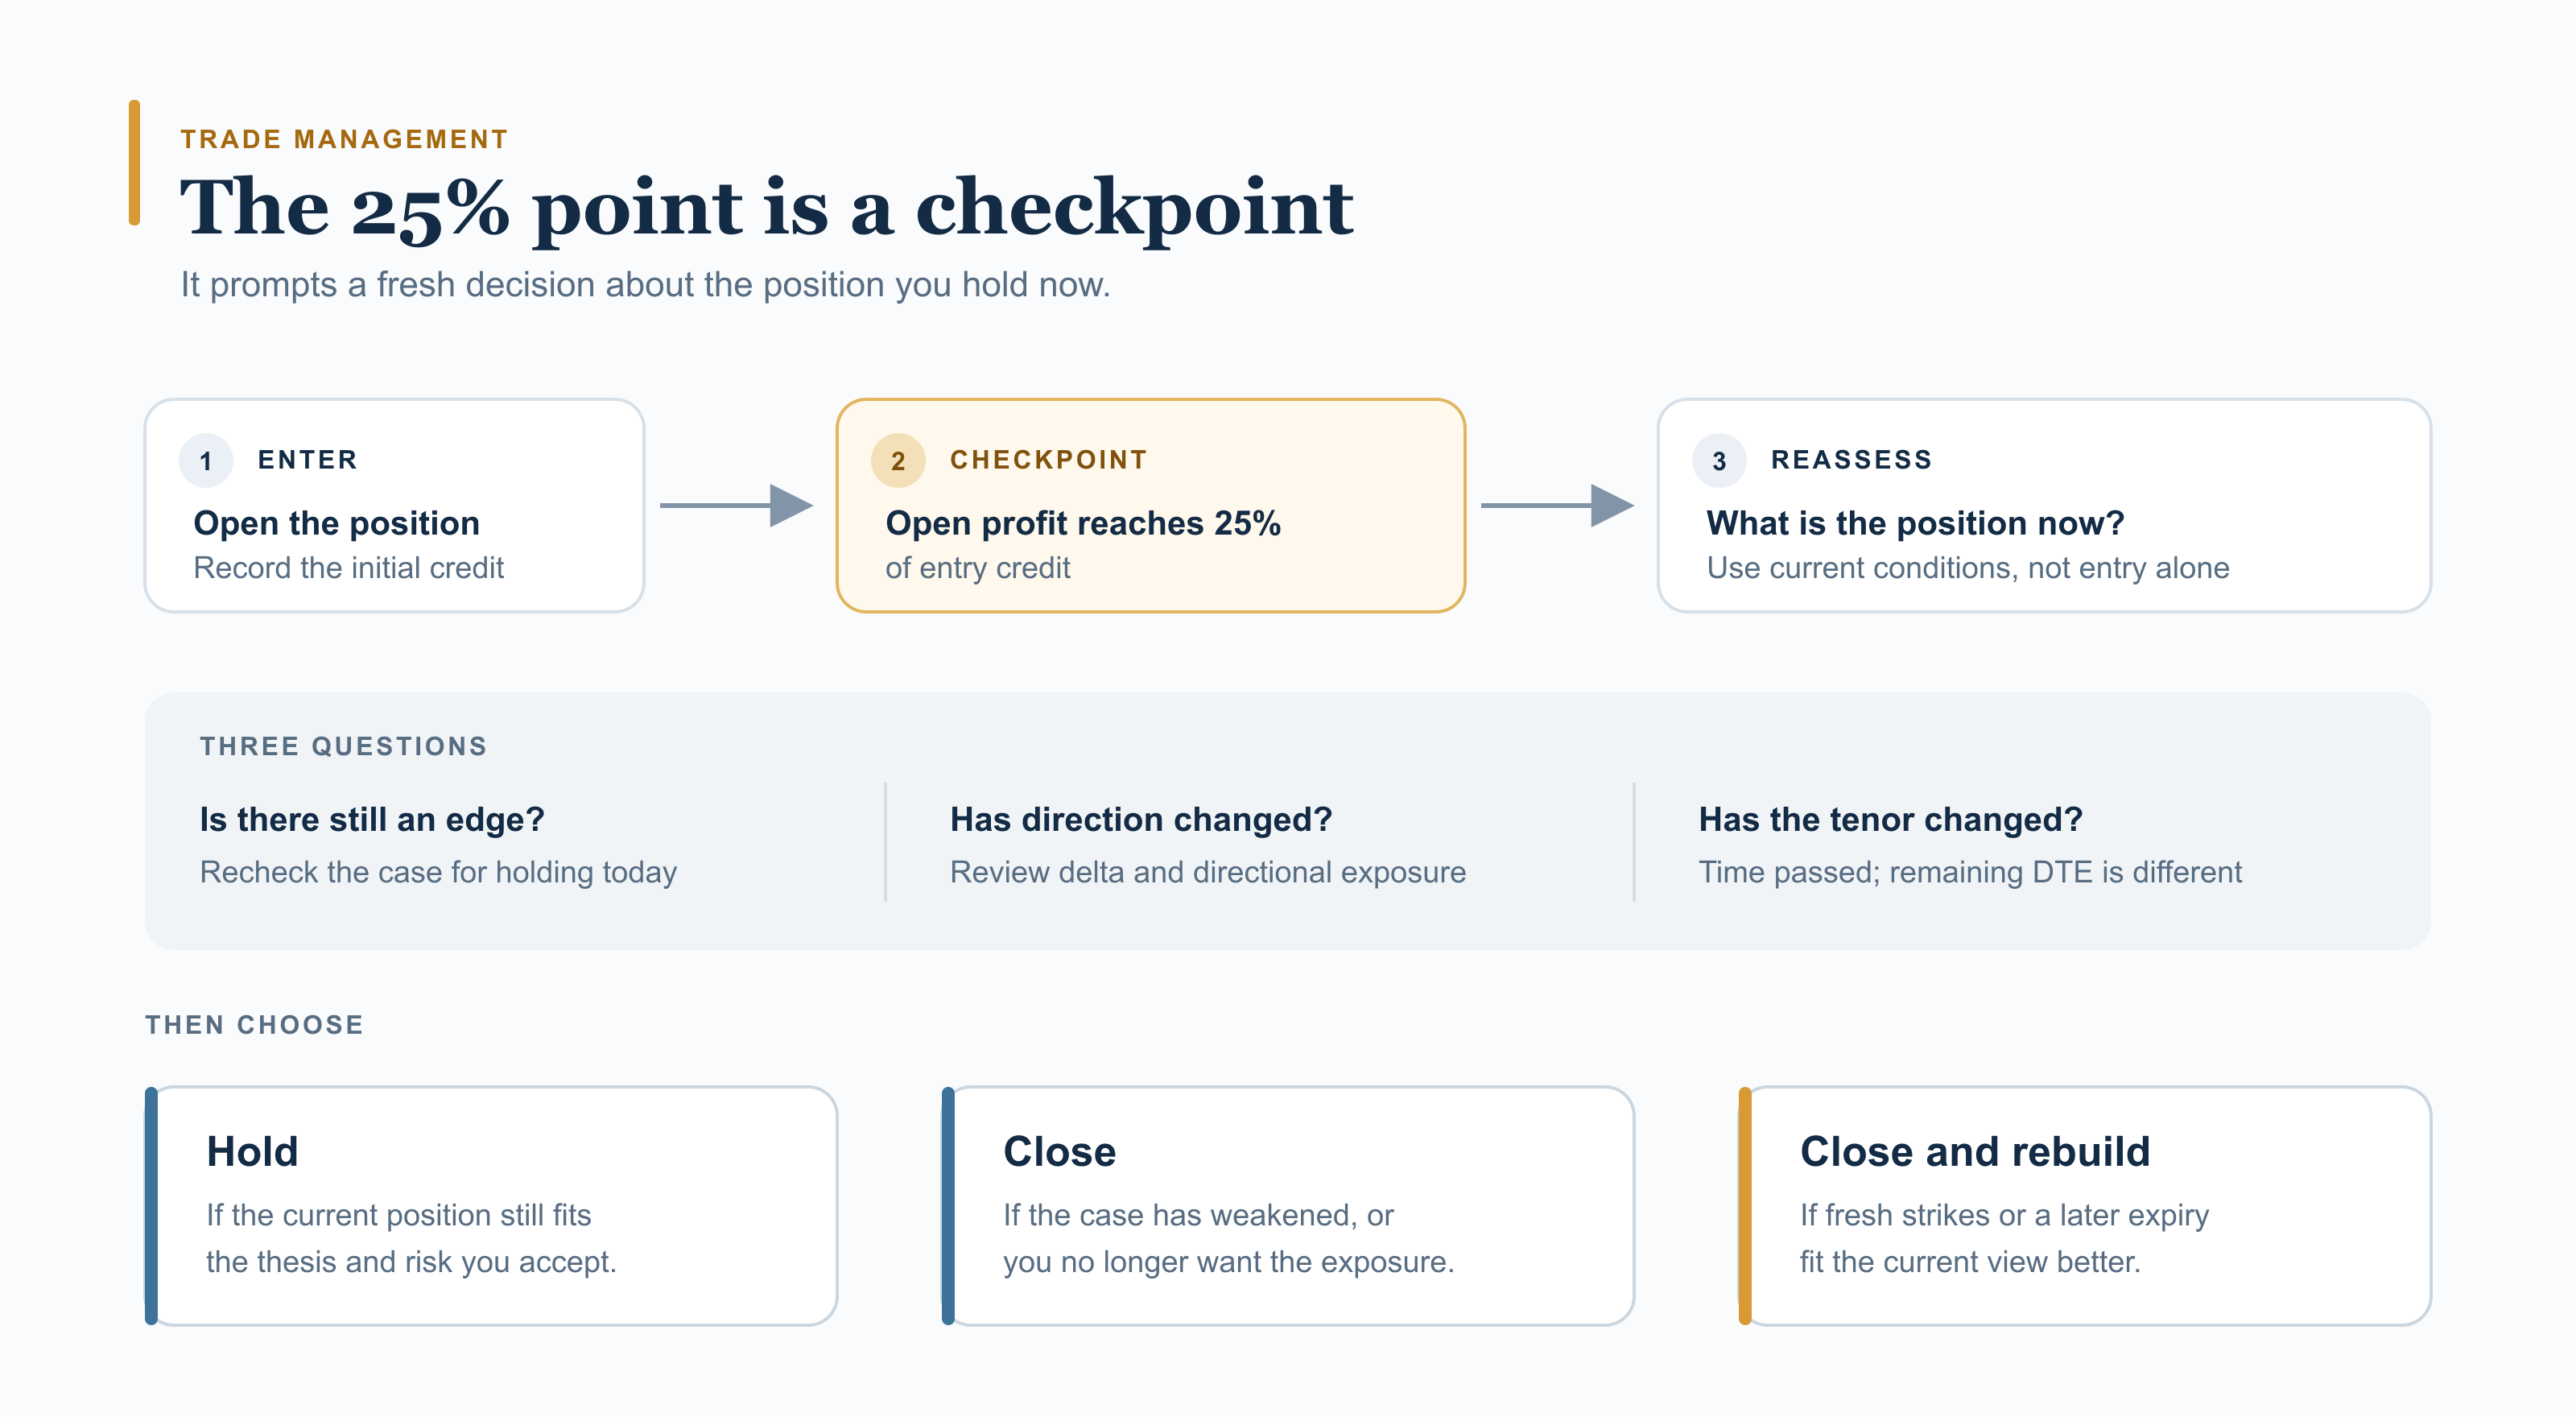
At 25%, reassess the edge, direction and time to expiry, then choose to hold, close, or close and rebuild.
What if the edge is still there? We often ask exactly that at the end of our Trade Anatomy articles. Look again at the probabilities: do they still show a strong likelihood that the implied volatility you would sell today will exceed the realized volatility that follows? Then look at the position: does it still express the view you want?
Treat 25% as a checkpoint to review today's edge: harvest if it has weakened; consider holding if it remains strong and the exposure still fits.
If we keep the view, we still decide how to carry it. We can hold the position as it is, or close it and rebuild in a later expiry with strikes that fit today's market. Either way, we keep only the exposure we still want, and we take the profit once the reason for holding has faded.
Pick the route that matches how you work. To check today's edge at each 25% checkpoint, subscribe to the platform for current volatility signals and surface analysis. To run the research yourself, use the Sharpe Two API.
Discussion
0 COMMENTSLog in to join the discussion.