research · Nov 11, 2026 · 13 min read
Using Claude to build a Sharpe Two trading strategy

Sharpe Two exists to give individual traders research they can actually use, so they can run their own money like a fund would. That means looking for the corners of the market where buyers pay too much for options, and are big enough for the edge to matter.
Short-dated SPY options are one of those corners. Over the last few years 0DTE and 1DTE options have taken a large share of S&P 500 option volume. A lot of that volume comes from people who need protection now and don't care much about the price. Those are the buyers you want to sell to.
This post walks through how we built a small overnight strategy on SPY from scratch, one question at a time, using Claude and our data. Every chart comes with a prompt you can use to explore the analysis, change a number and see what happens.
How to run the prompts. Use Claude with code execution and the corresponding SPY data. The quote-based tests use stock and option quotes; the final voting test also uses Sharpe Two's historical Nightcall entry signals. Our API documentation is the starting point for bringing Sharpe Two data into your own research.
The trade used in the backtests: at 15:55 New York, sell the nearest out-of-the-money put and call that expire the next session. Size the pair so it collects $1,000 of premium. Buy it back at 09:35 the next trading session. You are paid to carry the overnight gap.
Why overnight?
Picture a heavy session in US equities. A big close-to-close move, intraday volatility high all day. Now it's 15:55 and the short-dated options are, as you'd expect, expensive. Would you sell them?
Most people won't. After a day like that, the reflex is "what if it gets worse?" Sellers step back. And the buyers get more motivated for the same reason: they want the hedge at any price.
Selling here is selling insurance. The job of an insurer isn't to write every policy. It's to know when the premium is worth the risk, and when to let someone else take it.
Our SPY volatility-spike case study asks the same question over a longer holding period, then compares the structures we could use to express the view.
Two things volatility does
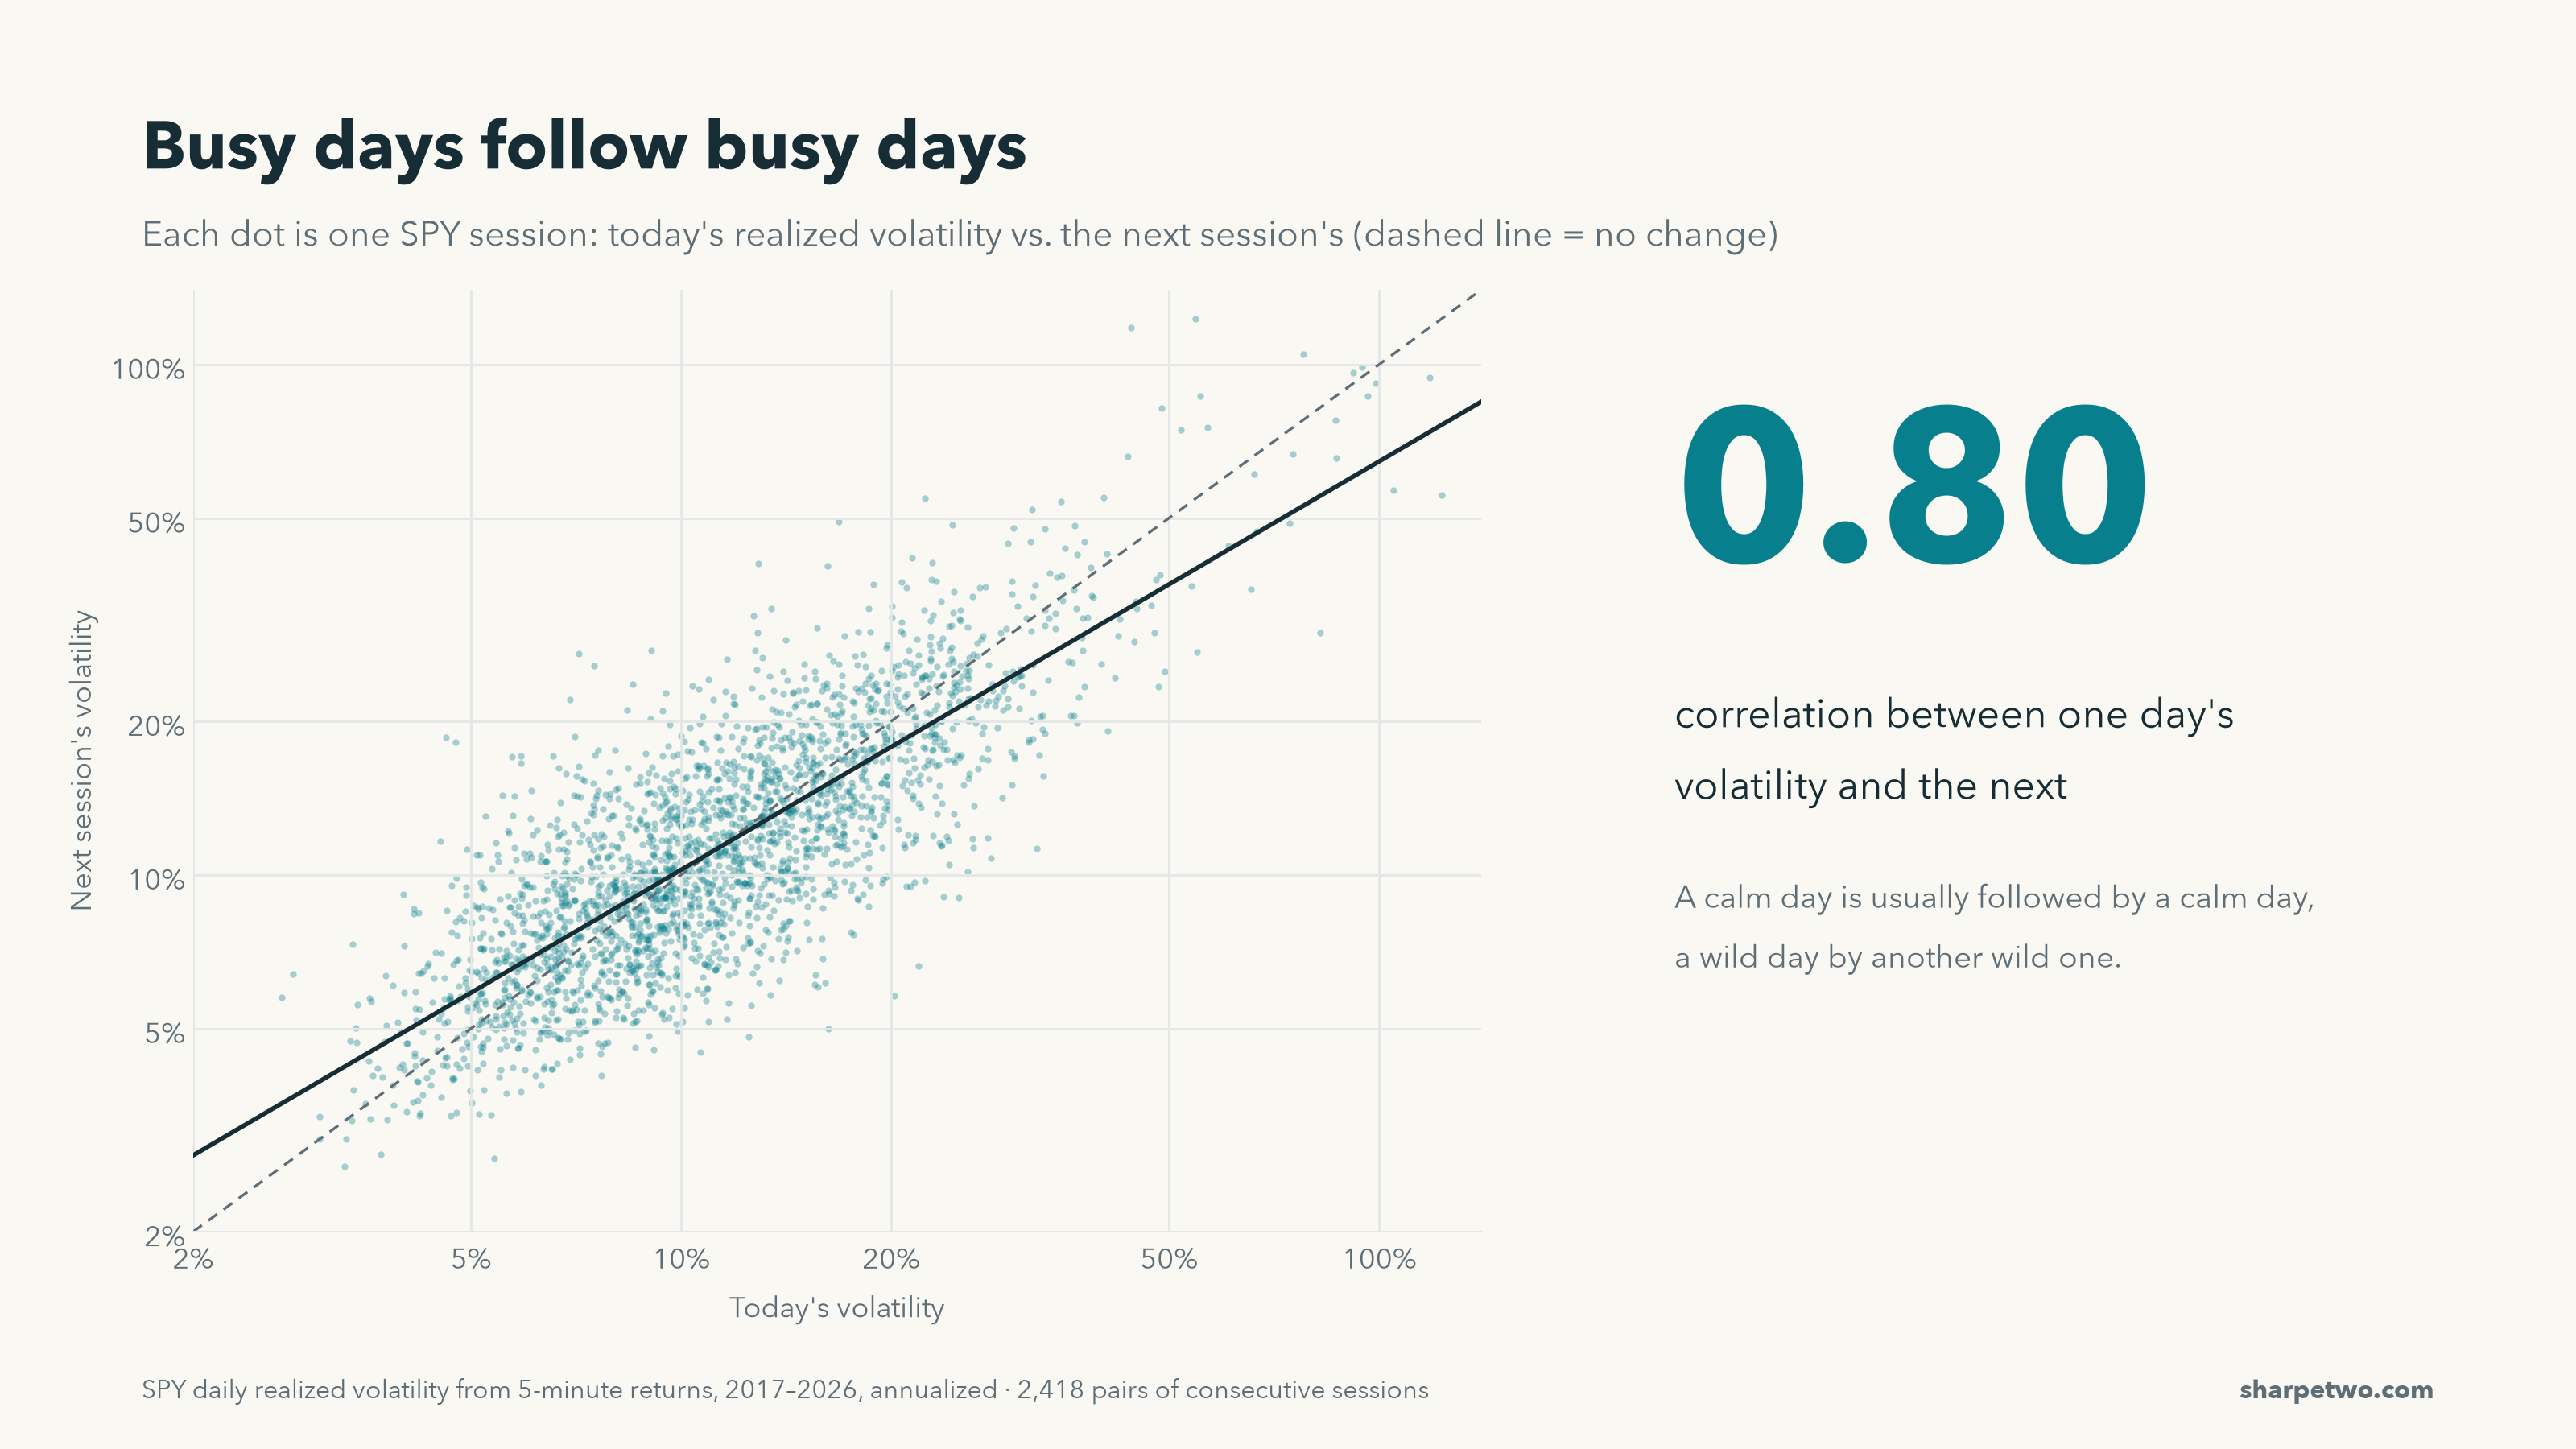
Volatility clusters. When markets are agitated, they tend to stay agitated for a while before settling back. A busy day is usually followed by another busy day, a calm day by another calm one.
Prompt
Using Sharpe Two SPY daily realized volatility (5-minute returns, January 2017 through 9 November 2026), plot each day's RV against the next trading session's RV on log axes. Add the y = x line and a fitted line, and report the lag-1 autocorrelation of log RV. Skip half-days and missing sessions.
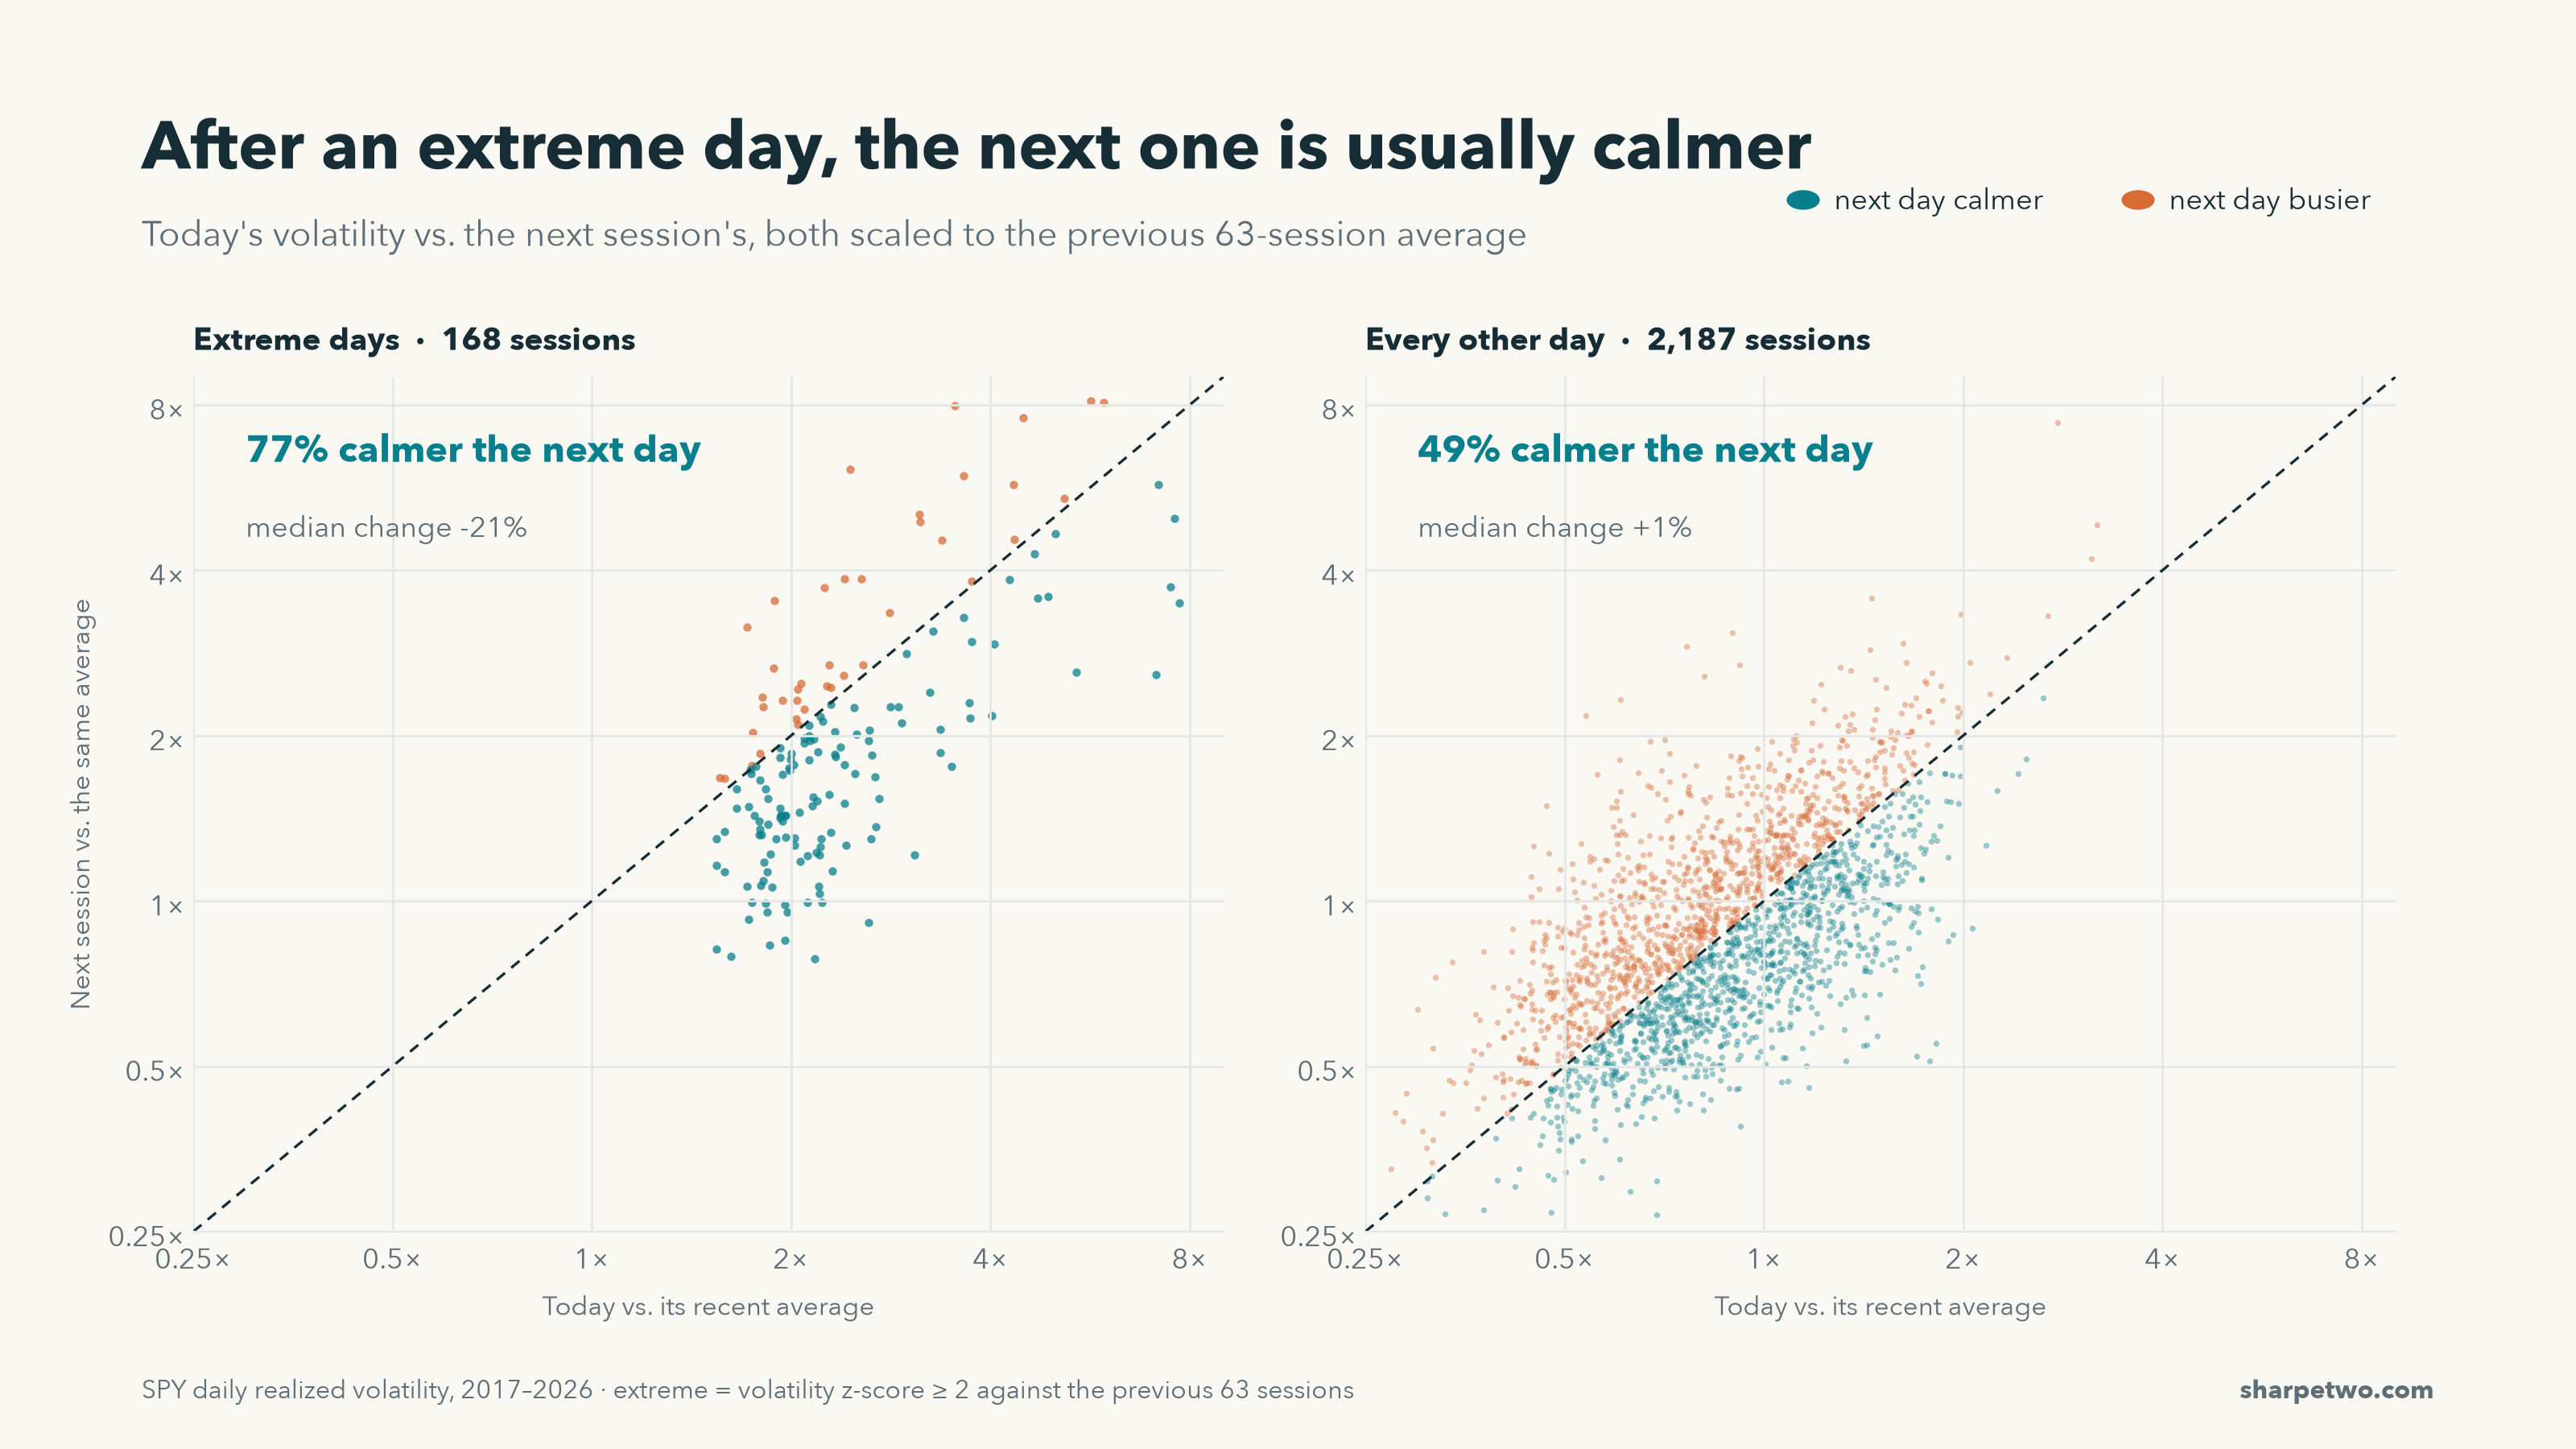
But extremes cool off. Even inside a volatile stretch, the day after an extreme session is usually calmer. Still elevated, but calmer, as if the market is catching its breath.
We call a session extreme when its RV is at least 2 standard deviations above its average over the previous 63 sessions. That happened 168 times since 2017. After those days, next-day RV came in lower 77% of the time, with a median drop of 21%. After normal days it's a coin flip.
Prompt
Using Sharpe Two SPY daily RV (January 2017 through 9 November 2026), z-score each session's RV against the previous 63 full sessions, excluding today and using sample standard deviation. Split sessions into z >= 2 and z < 2. For each group, plot today's RV against the next session's RV, both divided by the same 63-session average. Report the share of points below y = x and the median change.
So here's the setup we're hoping for: a market still rattled by a busy session, still willing to overpay for protection, right before things get quieter.
First try: sell after a high-volatility day
The obvious test: sell every night, versus sell only on nights when today's RV is extreme.
Shared backtest setup. Entries run from 14 November 2022 to 6 November 2026, with the final exit on 9 November. All observation times are America/New_York. Use equal fractional put and call quantities to collect $1,000 of premium, and require valid entry and exit quotes for the same contracts. Rolling z-scores use the previous 63 trading sessions, excluding today, with sample standard deviation; load the earlier history needed for those windows. Sharpe ratios use calendar-day P&L, idle days at zero, and √365.25 annualisation. The first tests use midpoints; the final two comparisons use bid/ask fills. Commissions are not included.
Prompt
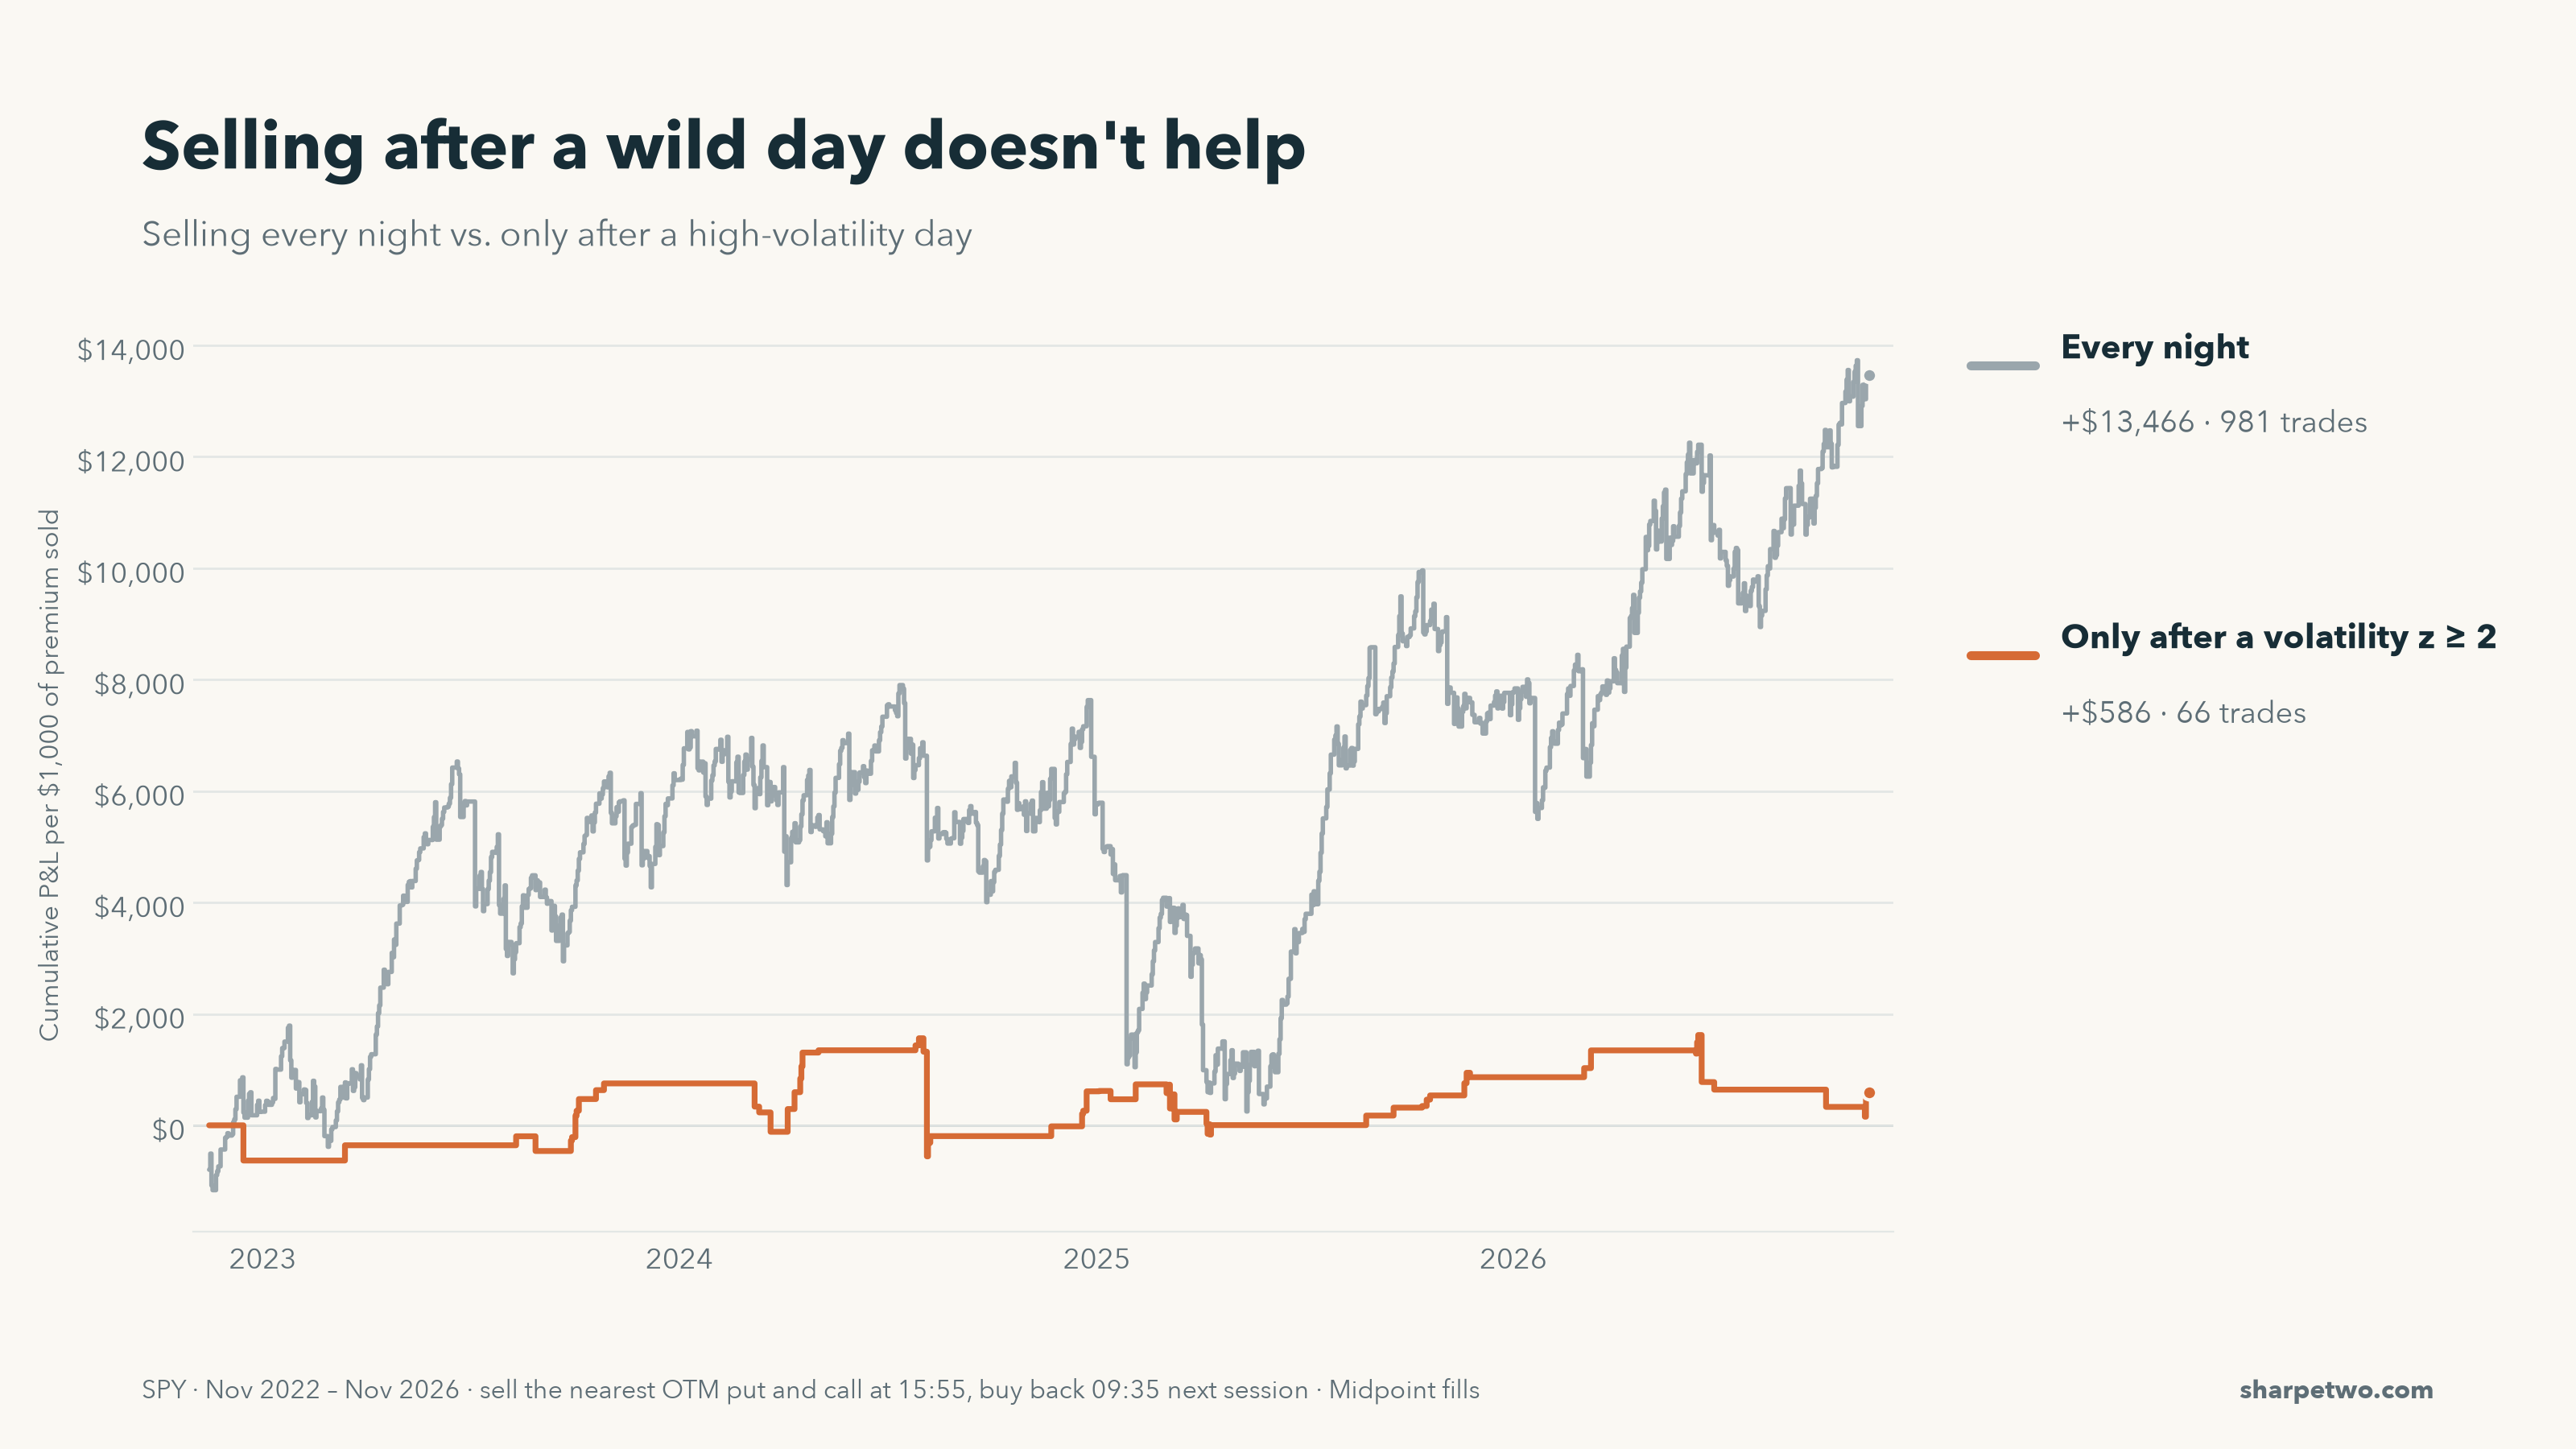
Using Sharpe Two SPY quotes and the shared backtest setup, compare two rules: (1) sell every eligible night, (2) sell only when the RV z-score at 15:50 is at least 2. The trade: at 15:55 sell the nearest out-of-the-money put and call expiring the next session, sized to $1,000 of combined midpoint credit; buy them back at 09:35 next session at midpoint. Plot cumulative P&L and trade counts.
Neither works well. Selling every night makes money, as you'd expect from selling options that are usually overpriced, but the ride is rough: the whole 2023–2024 gain disappears in spring 2025. With no way to tell when options are expensive, you just drift.
The RV filter is worse: 66 trades and almost nothing to show for them. That shouldn't surprise us. RV is backward-looking. It tells you the market moved a lot. It doesn't tell you whether the market expected to move a lot. To measure surprise you need a forecast to compare against.
And the market hands us one.
The option price is a forecast
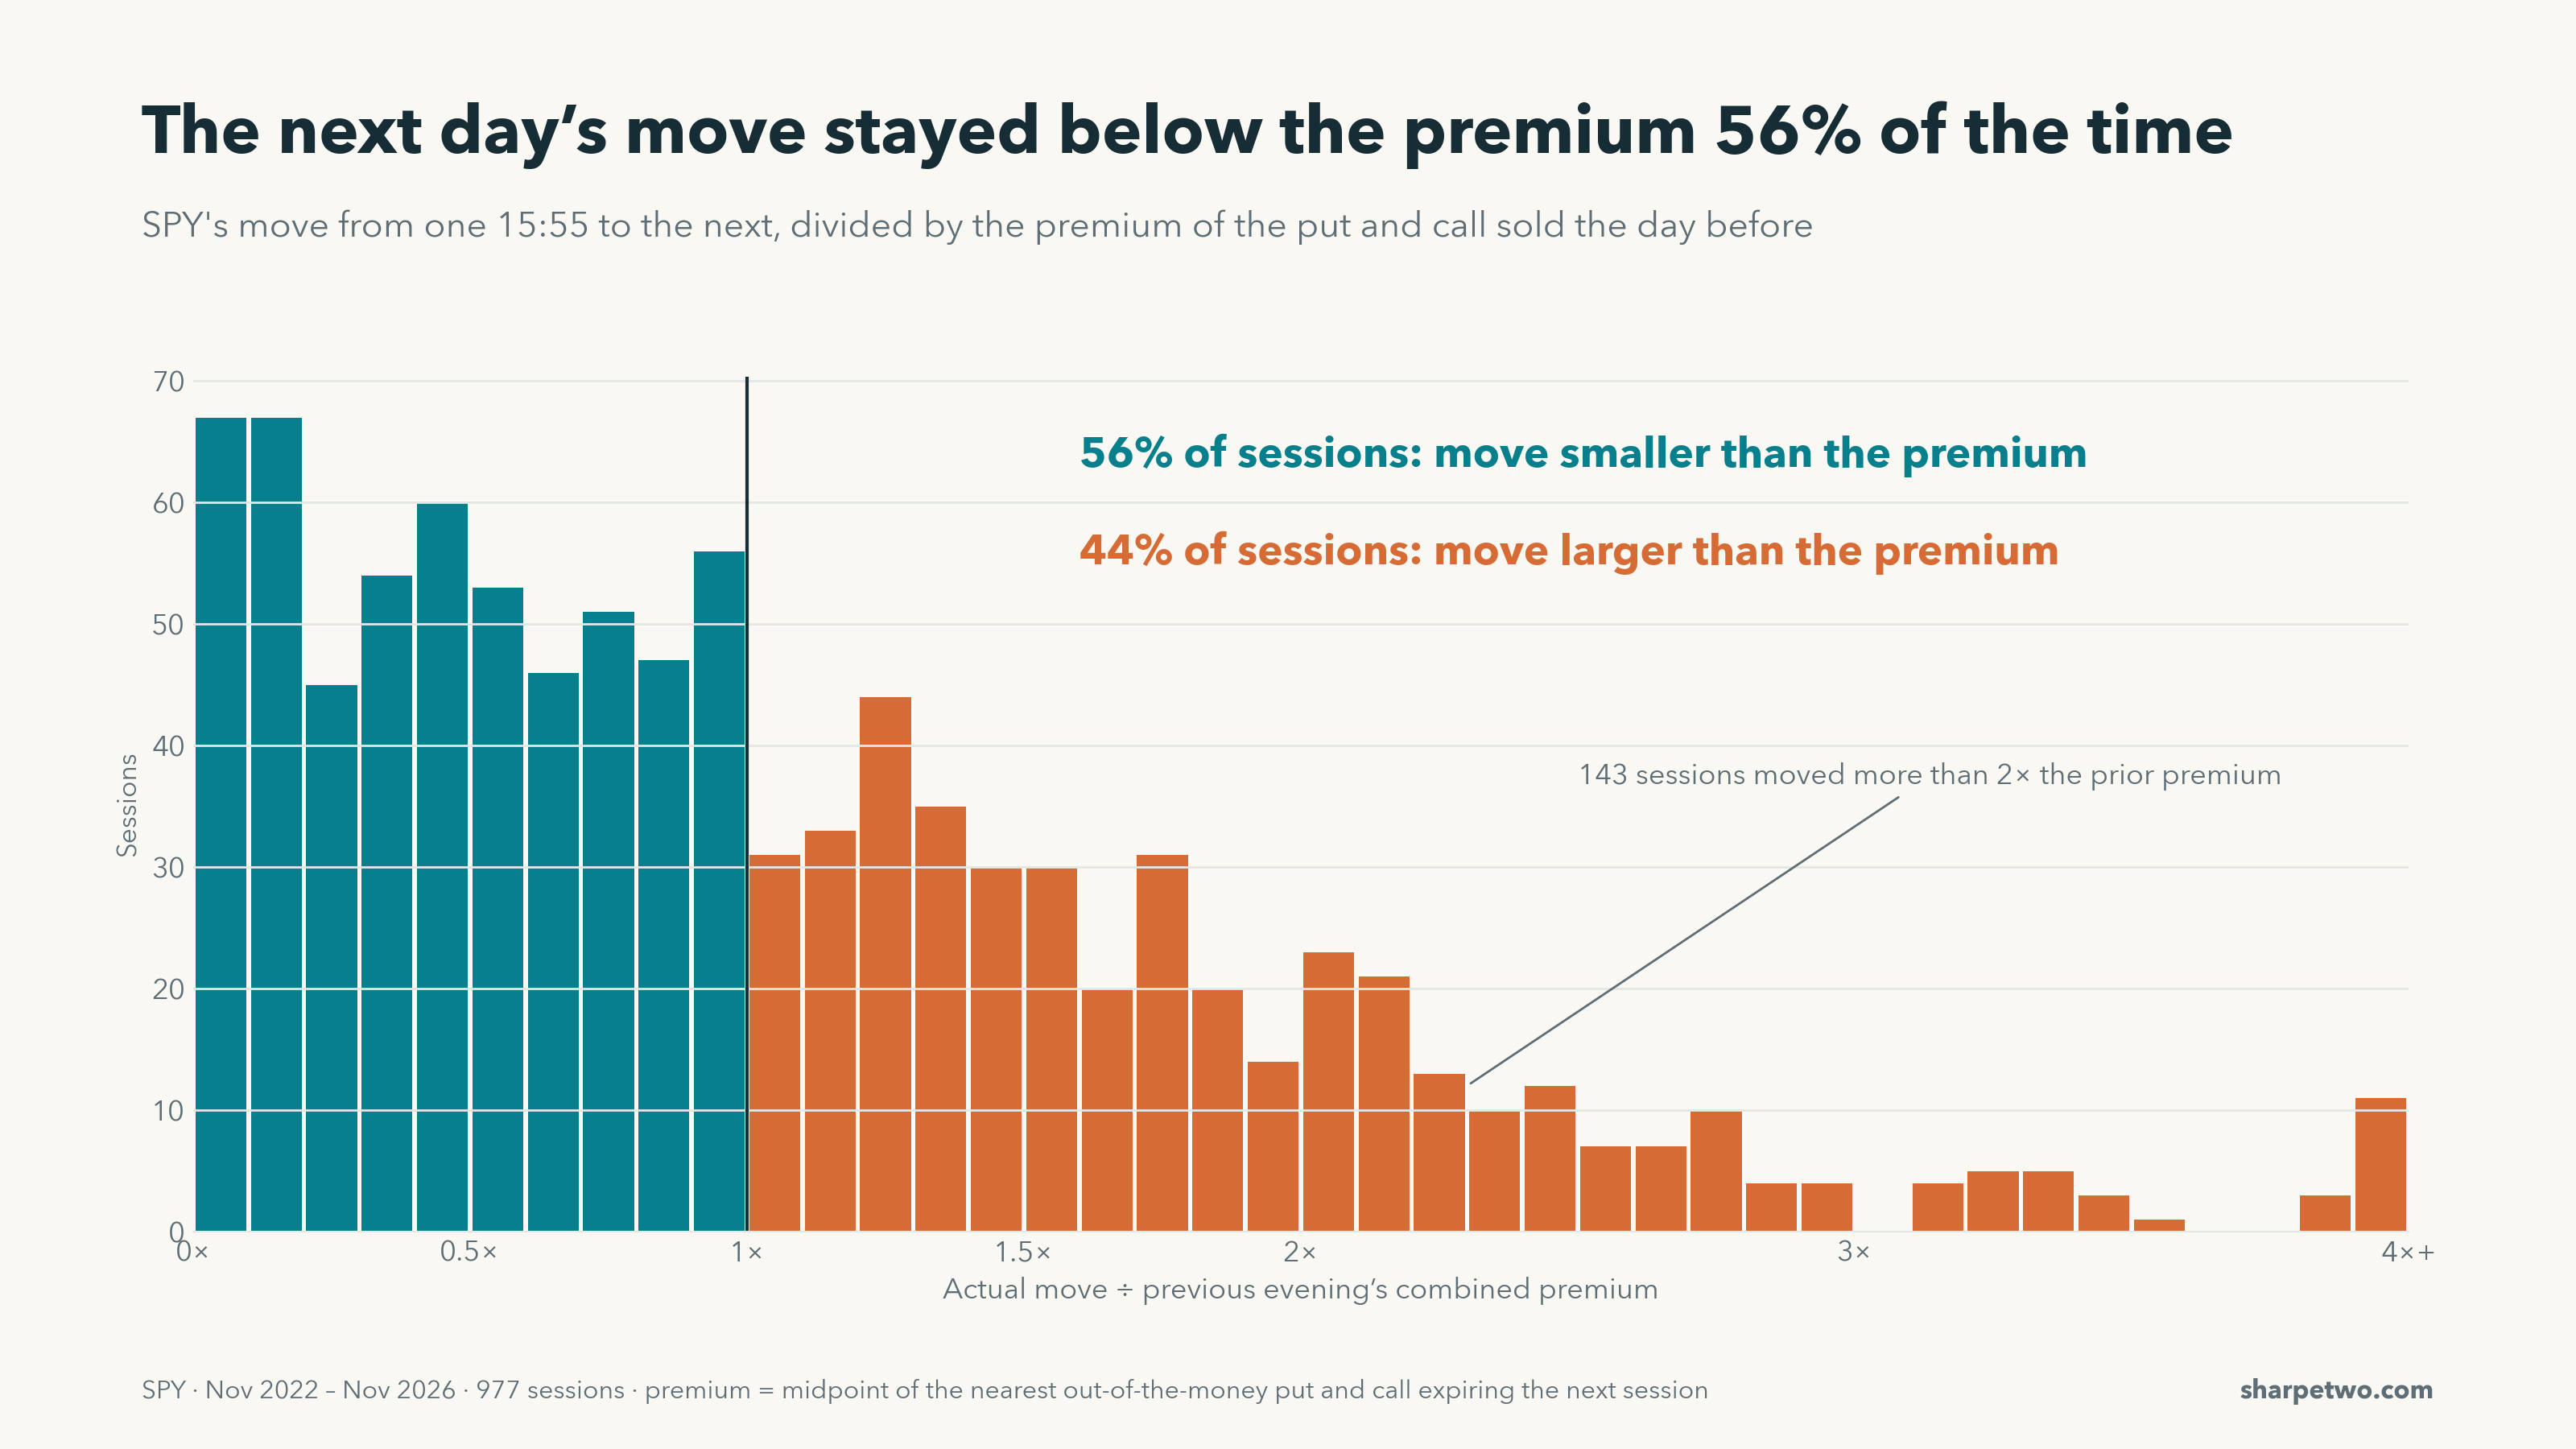
The combined premium of a near-the-money put and call gives us a market-priced move to work with. Before an FOMC or a payrolls number that price is high. On a normal day it's lower.
Which means every evening the market makes a forecast, and every next evening we can check whether it was right.
Prompt
Using Sharpe Two SPY quotes from 14 November 2022 through 9 November 2026, for each session divide the absolute SPY move from one 15:55 to the next by the previous session's combined midpoint premium of the nearest out-of-the-money put and call. Plot the distribution of that ratio with a line at 1.0, and report the share of sessions below 1.
In this sample, the next day's absolute move was smaller than the previous evening's combined premium 56% of the time. What about the other 44%, when the move exceeded the premium? Our hunch: a market that just got surprised raises its price the next day, so it isn't caught again. And that's the night to sell.
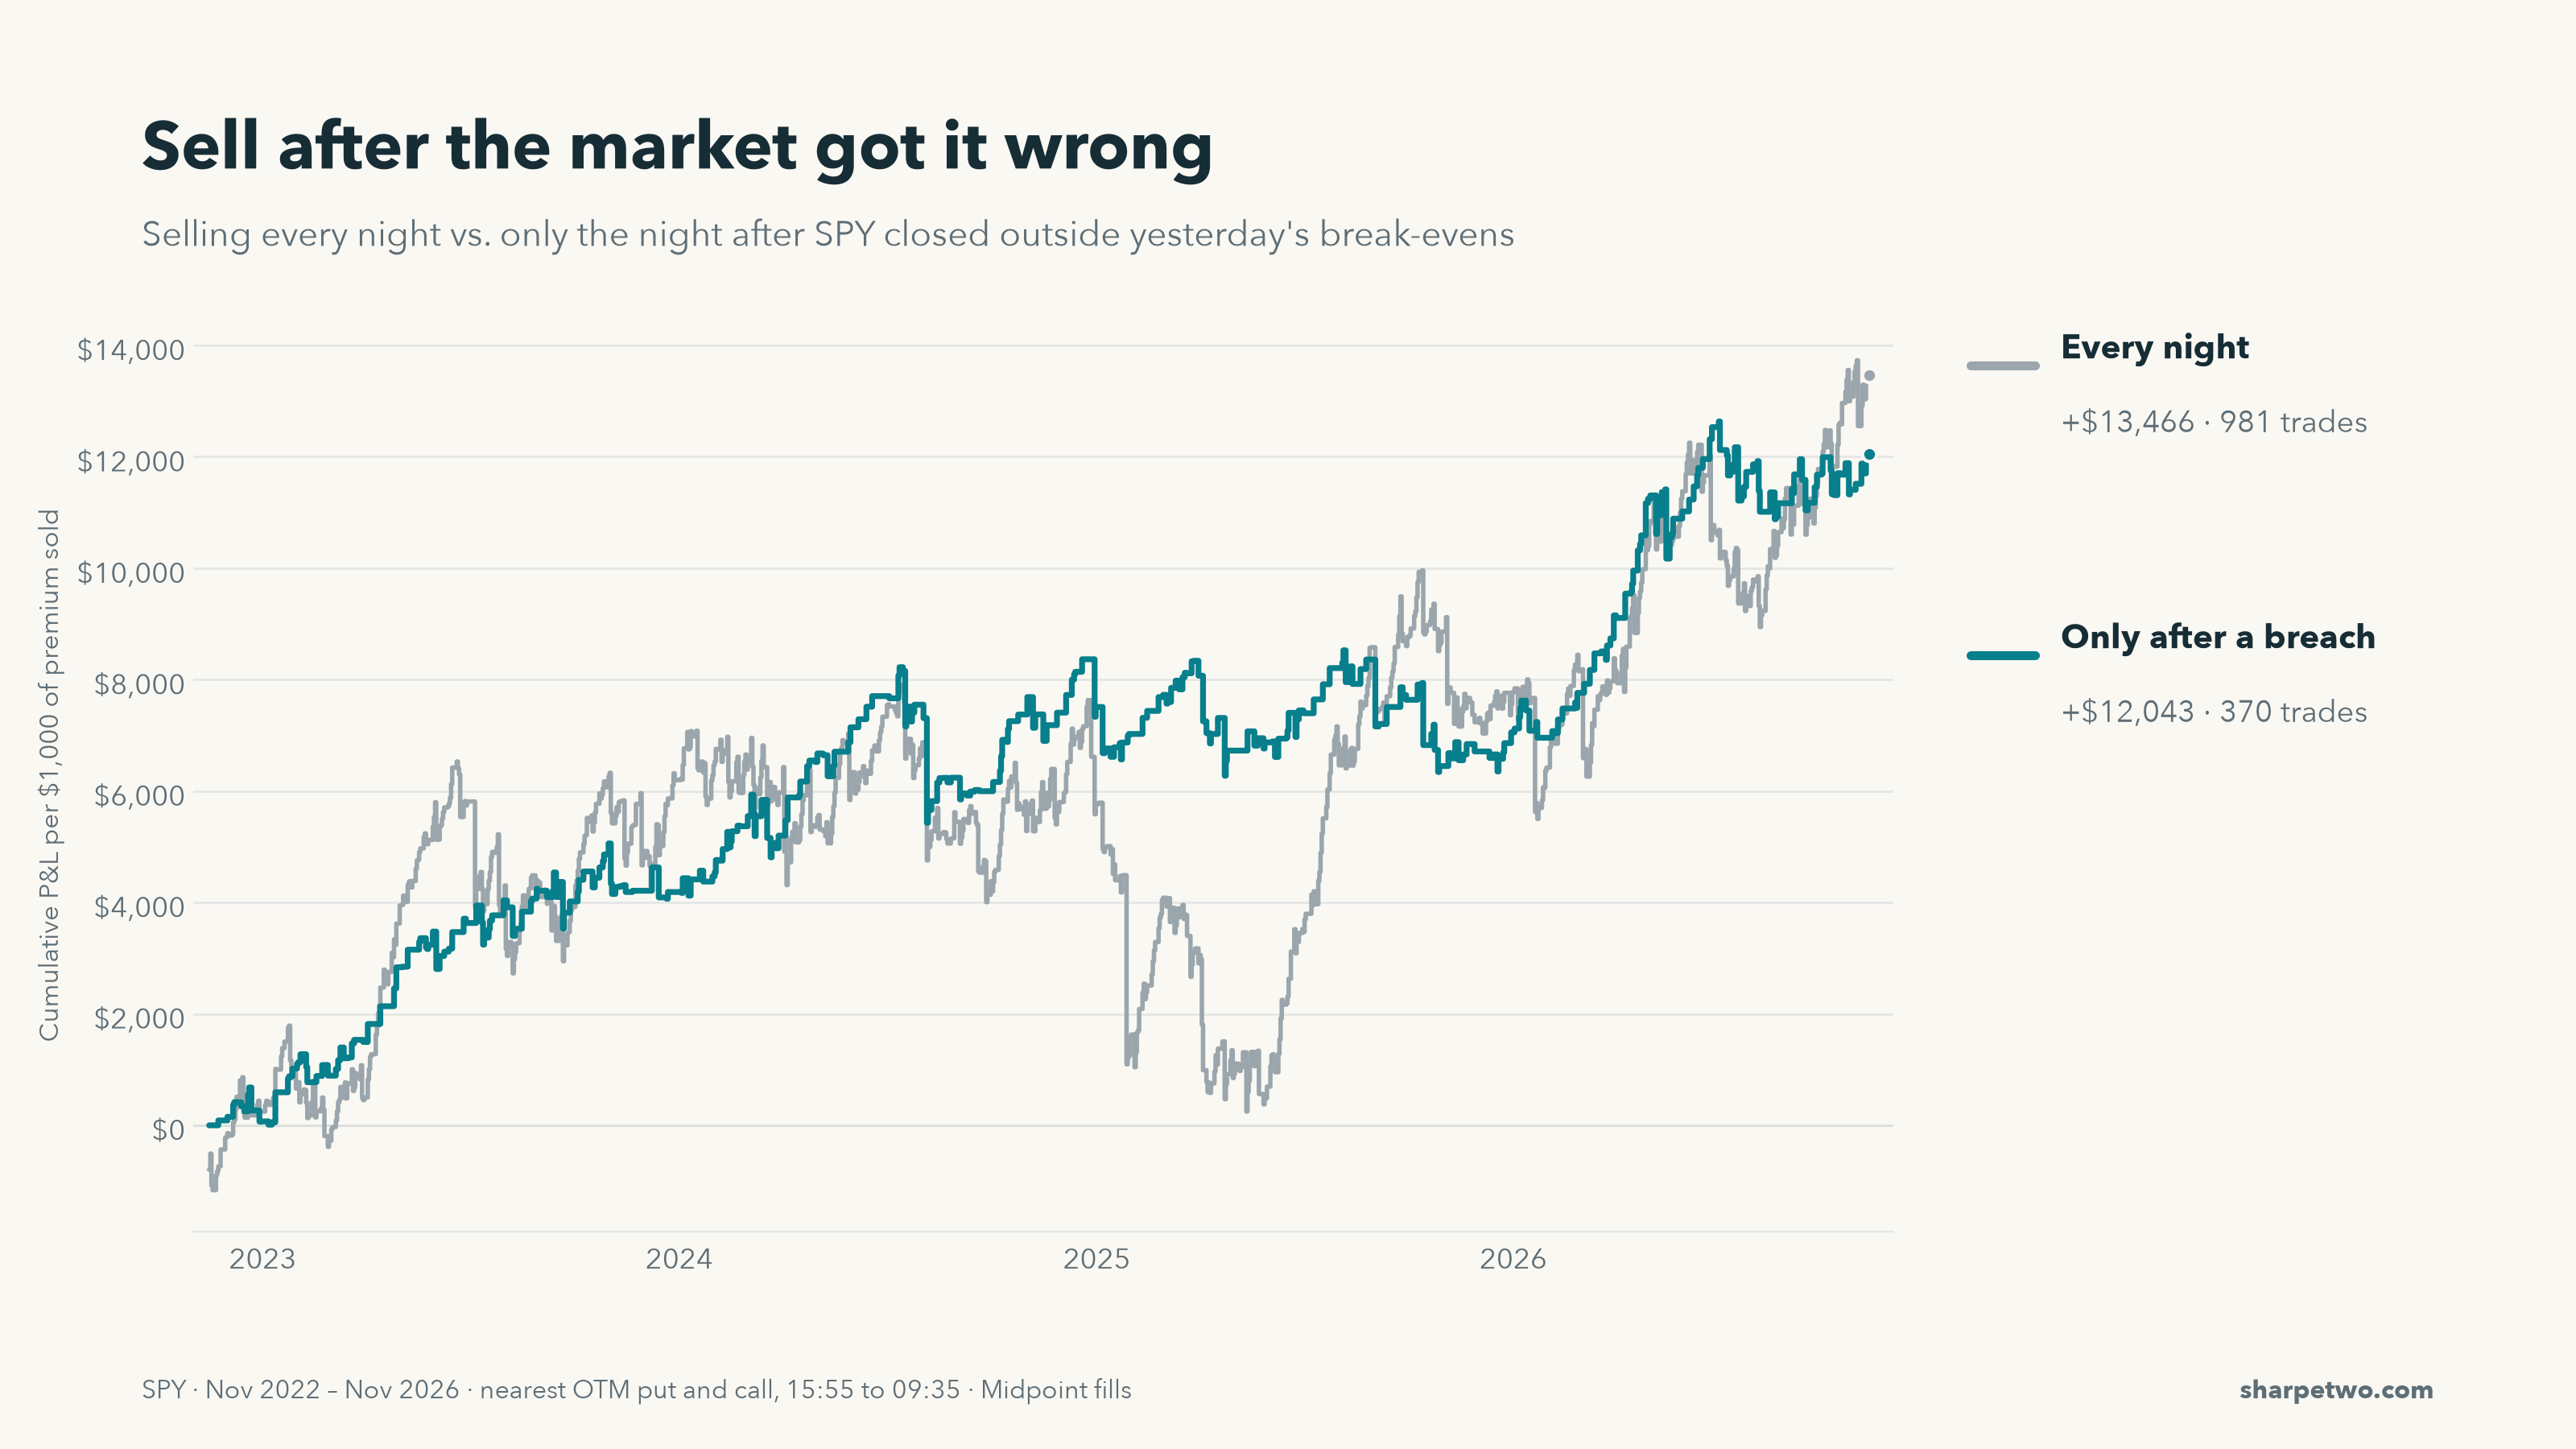
For the next trading filter, we also account for the strikes. We call it a breach when SPY at 15:55 sits outside yesterday's break-evens (put strike minus premium, call strike plus premium). Here's what happens if we only sell the night after a breach:
Prompt
Same trade and period as before. Only sell on nights when the 15:55 SPY midpoint is outside the previous session's break-evens: below the put strike minus the combined premium, or above the call strike plus the combined premium. Compare with selling every night. Plot cumulative P&L and trade counts.
Similar profit to selling every night, with 370 trades instead of 981, and the 2025 drawdown is mostly gone. Treating the option price as a forecast, and acting on whether that forecast was wrong, carries real information.
How big was the surprise?
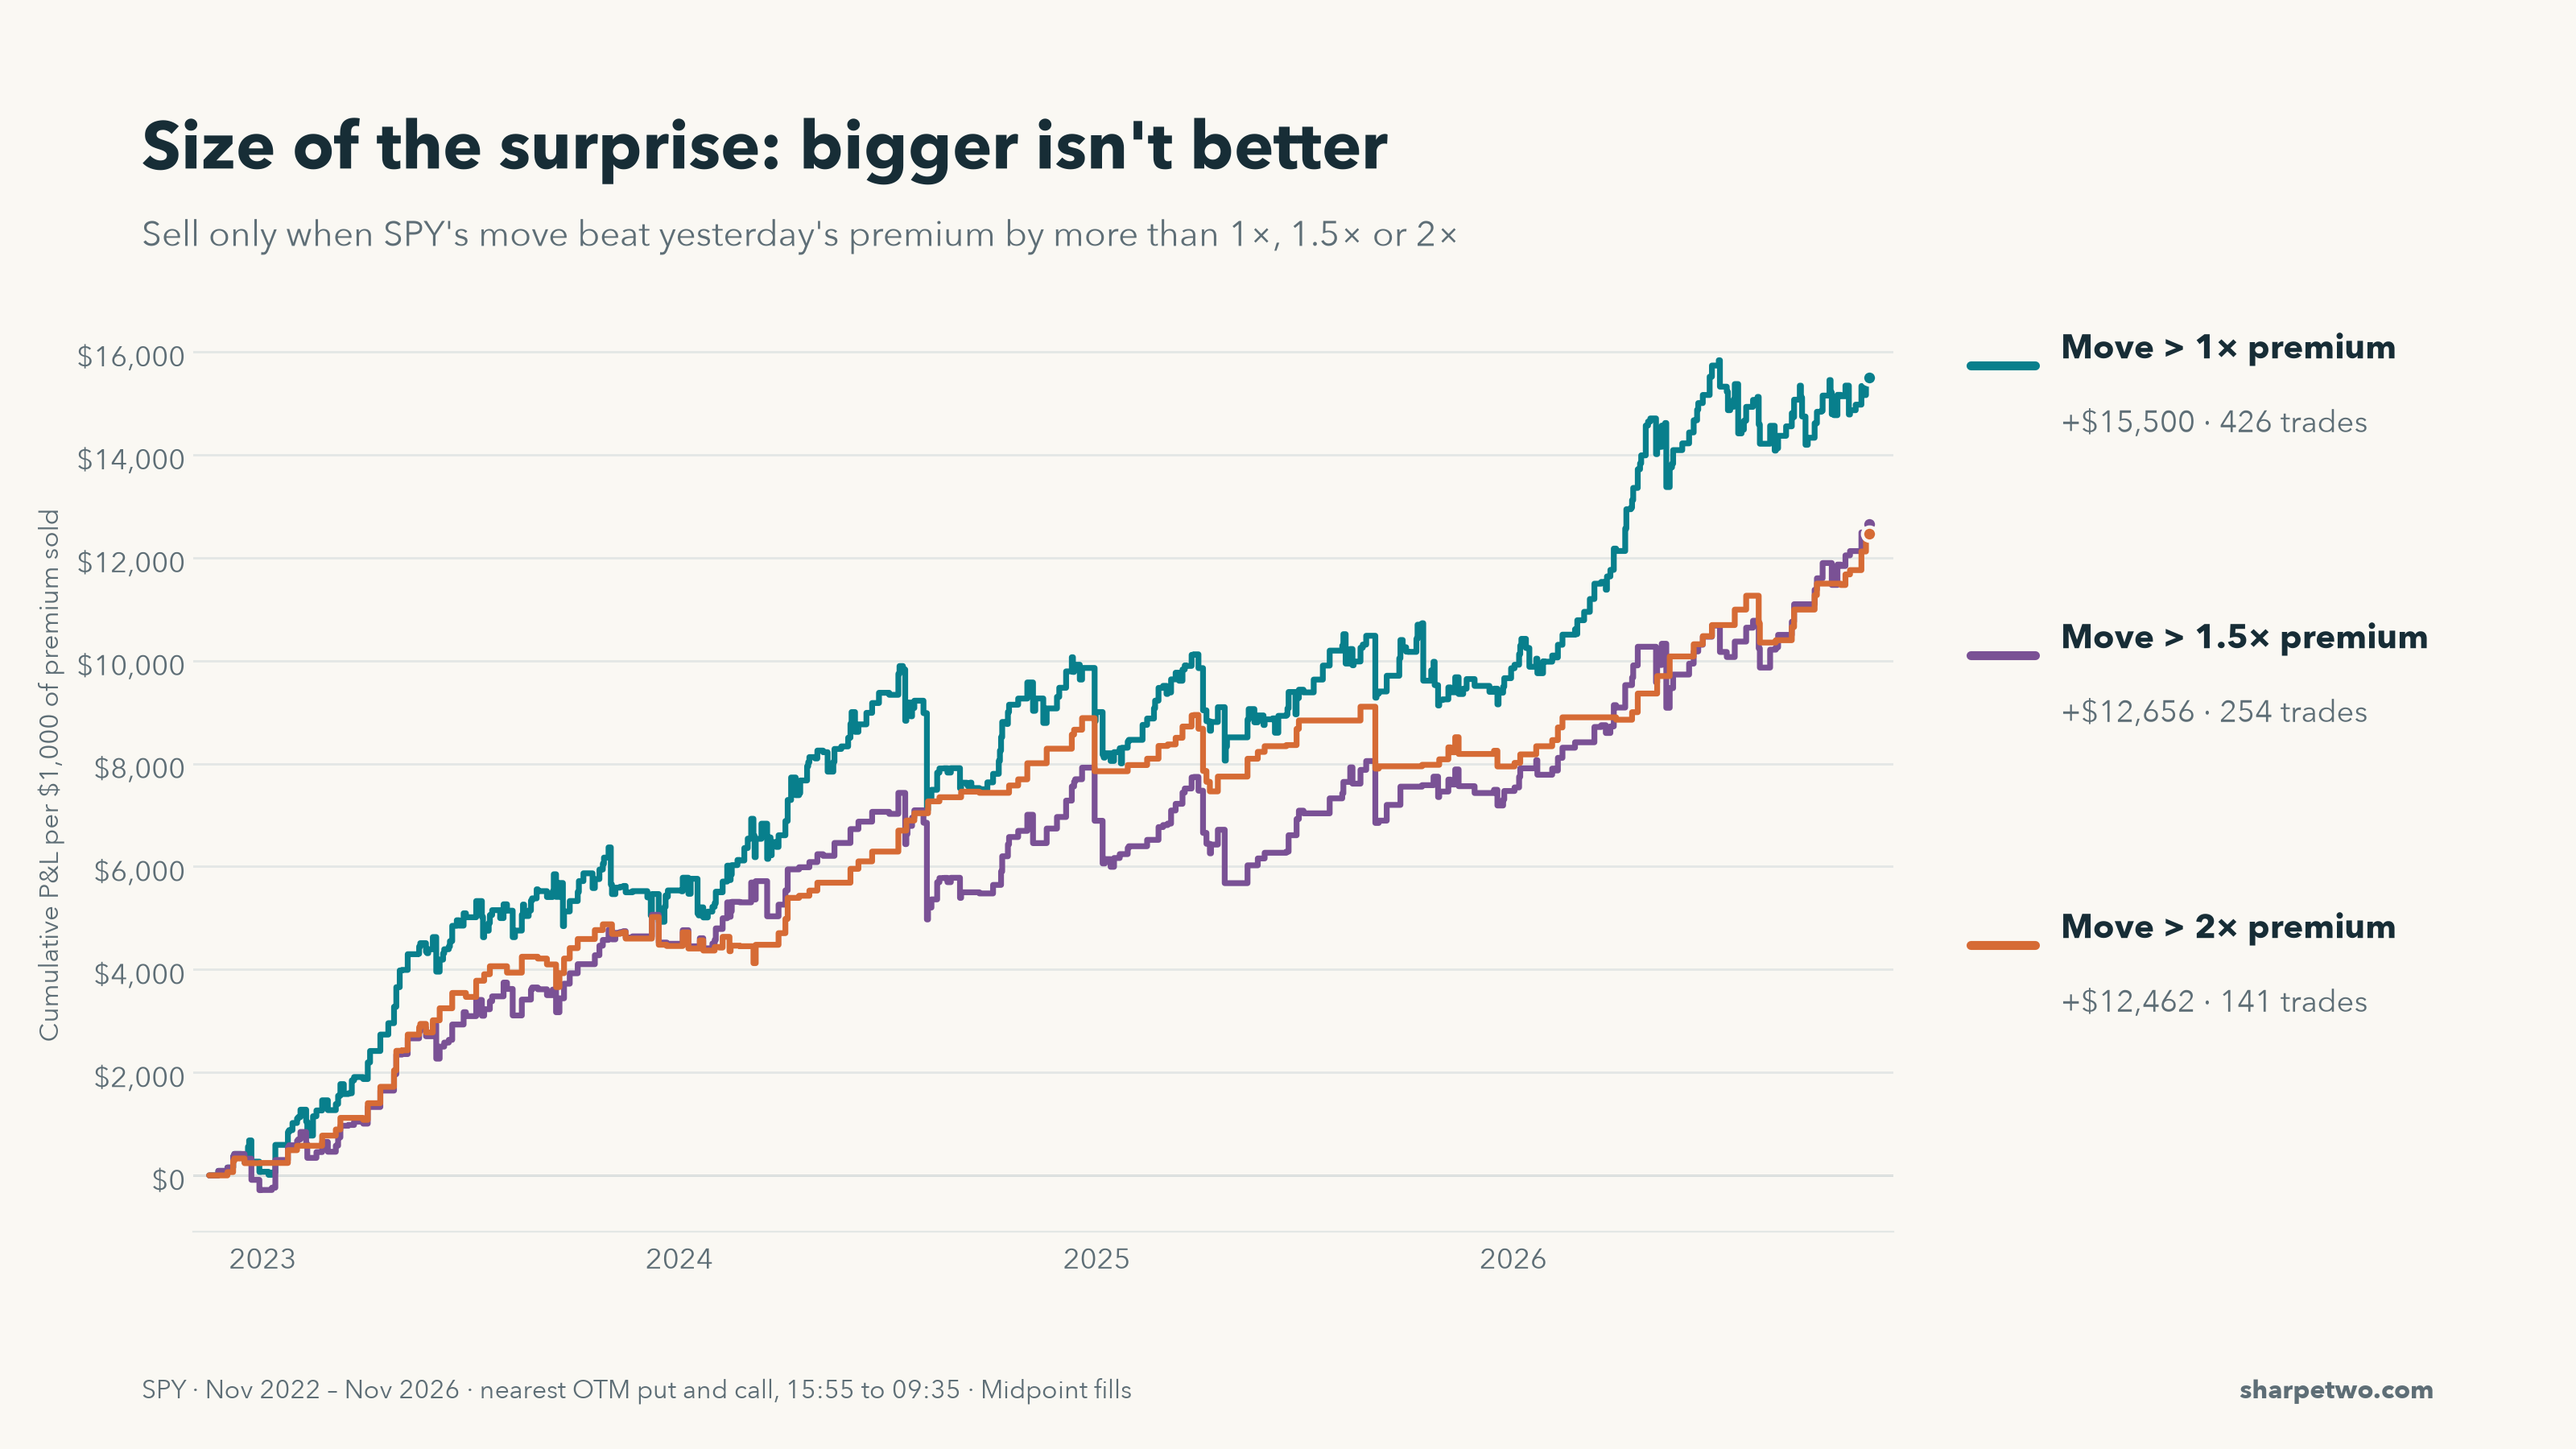
A 1.05 move against a forecast of 1 isn't much of a surprise. A move of 4 against a forecast of 2 is. So we measure surprise as a ratio: the actual move divided by yesterday's premium.
Big surprises are rare. Moves of more than twice the forecast happened about 140 times since November 2022, when SPY got expiries every weekday. That's about a third as often as moves above 1x.
Prompt
Same trade and period. Define surprise as the absolute SPY move between the previous and current 15:55 midpoints, divided by the previous session's combined premium. Compare selling only when surprise > 1x, > 1.5x and > 2x. Plot cumulative P&L and trade counts.
Not perfect, but there's something there. If the market got wrong-footed today, it may charge a little extra not to be wrong-footed again overnight.
You can also see the usual shape of a short-volatility strategy: steady gains, then now and then a sharp loss that wipes out weeks of profit.
Looking for a second feature
The temptation now is to keep tuning the threshold until the curve looks perfect. That's how you end up with a backtest that never works live. A better move is to look at the problem from another angle, and see if a second feature confirms the first.
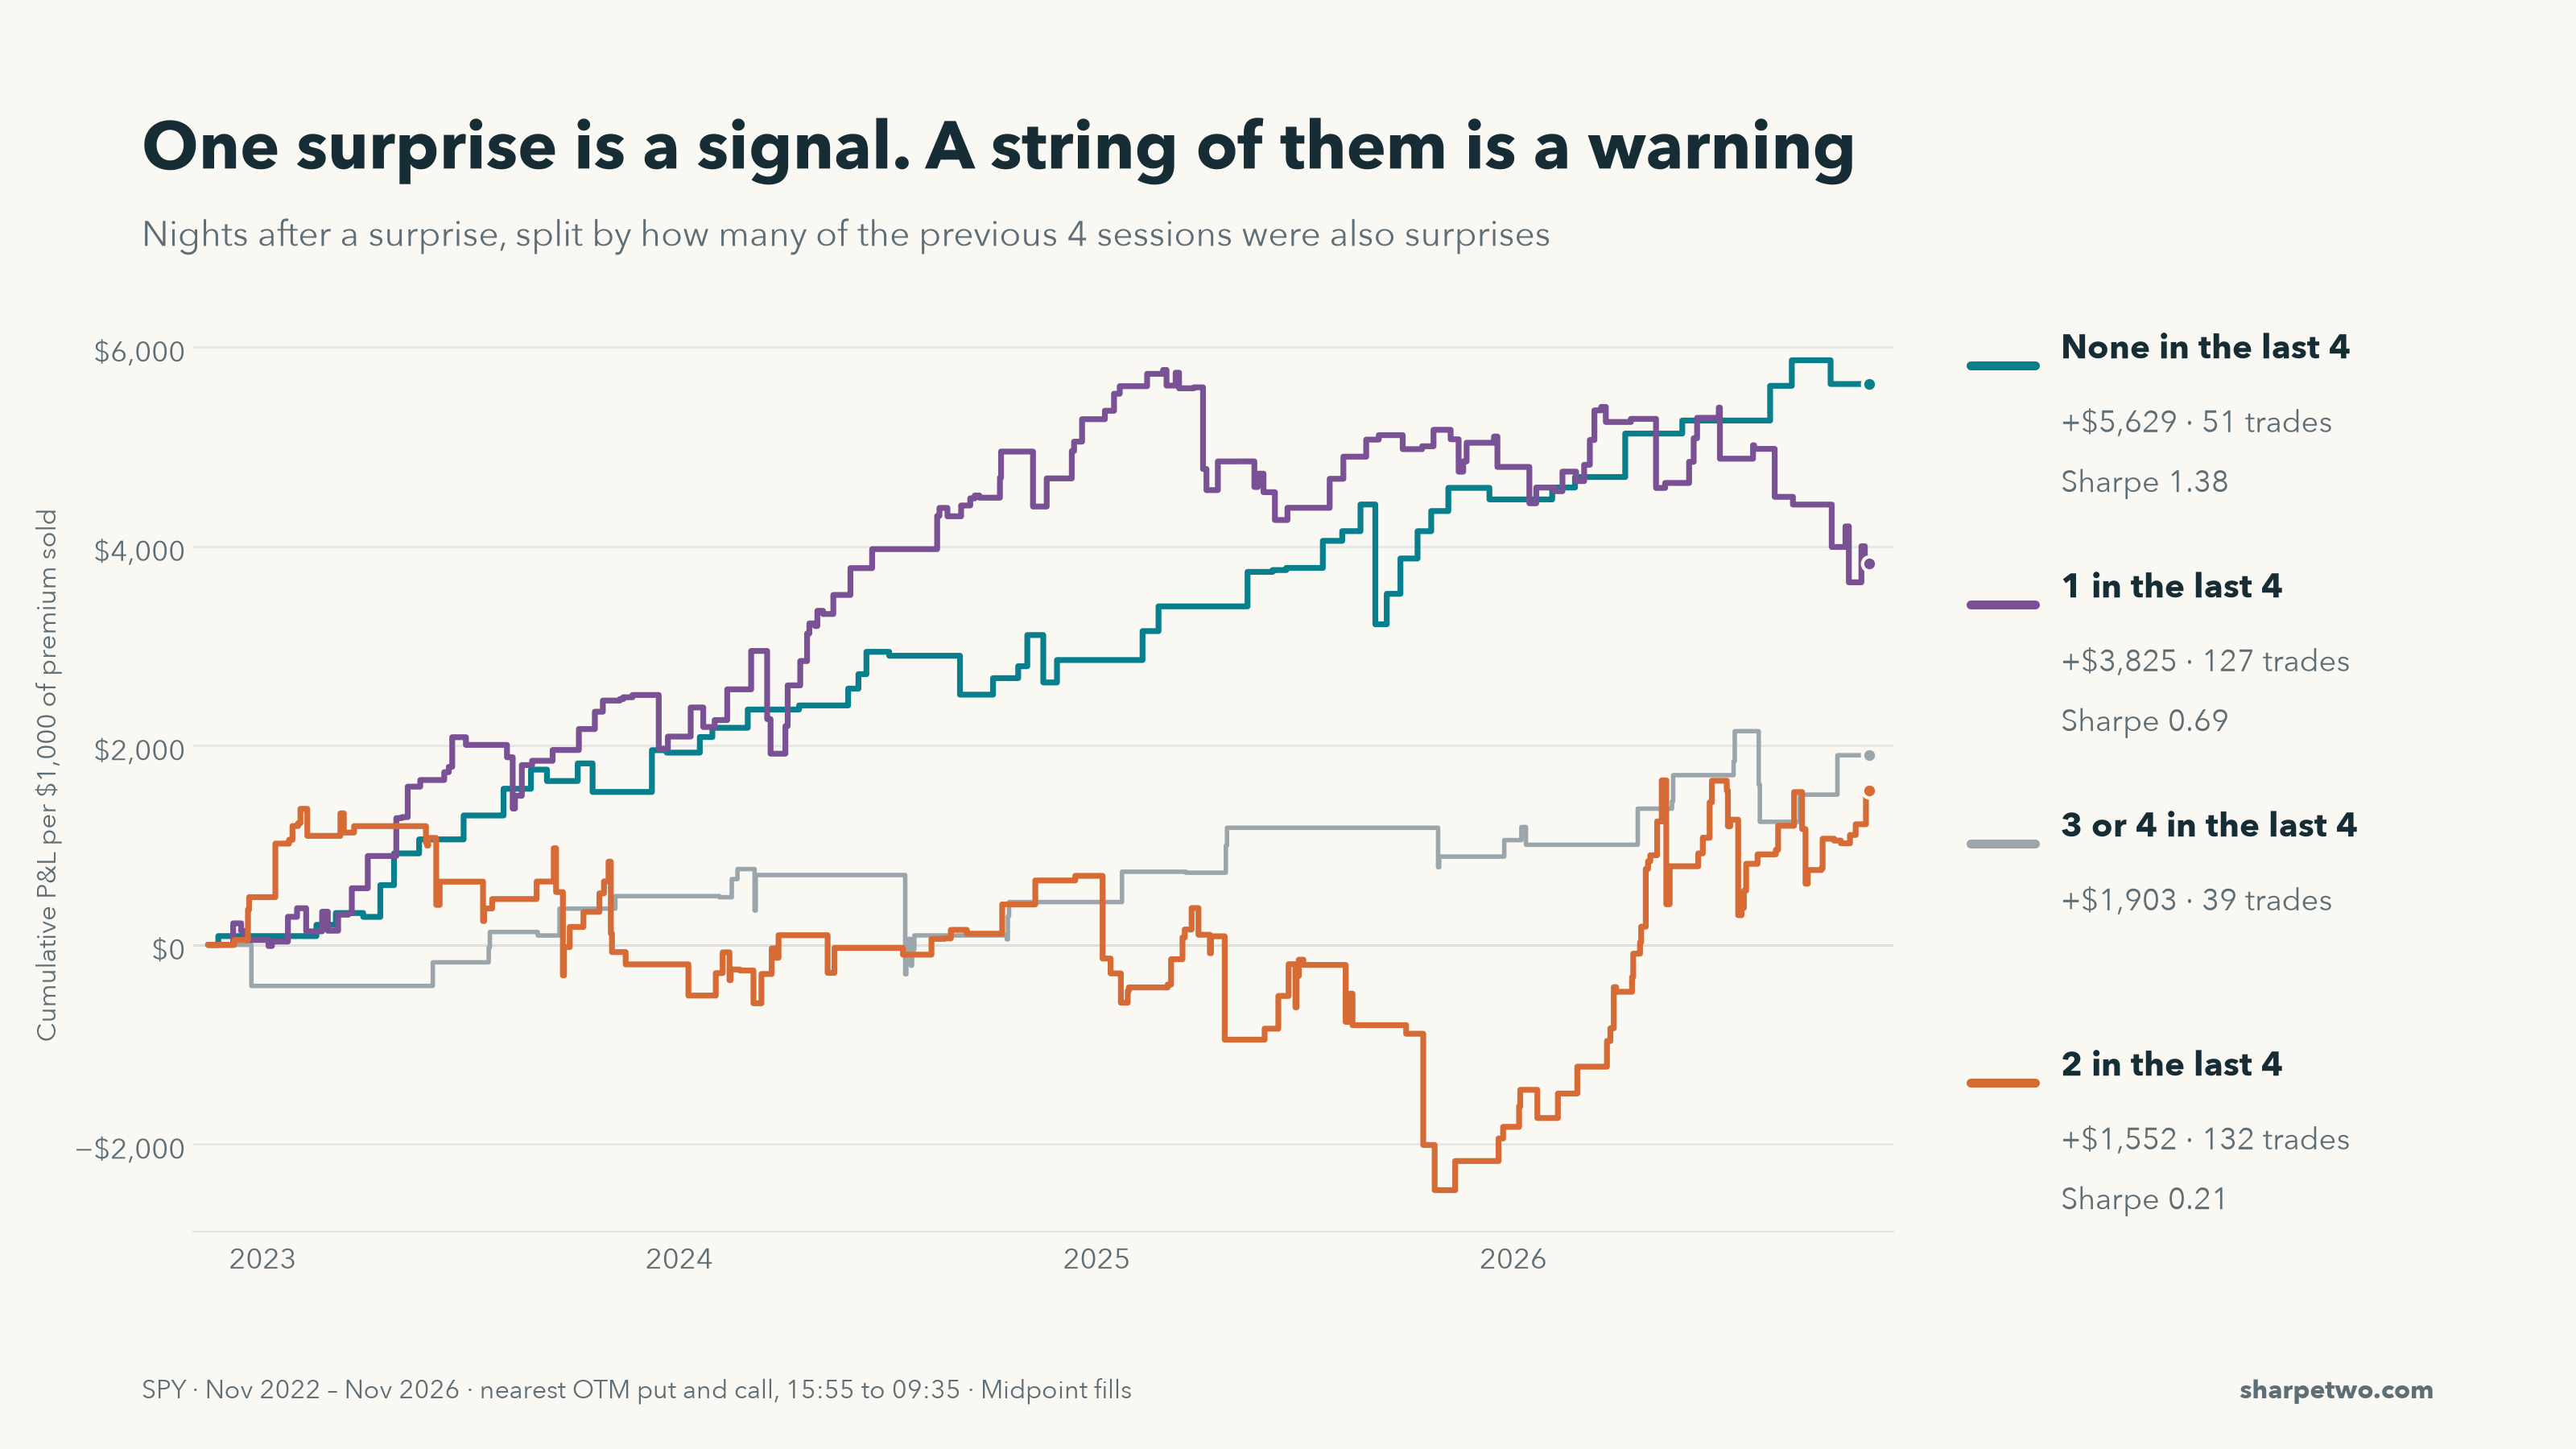
Do surprises cluster? If three or four of the last four sessions were surprises, maybe that's telling us something about tonight.
Prompt
Same trade and period. On nights with a surprise (SPY outside yesterday's break-evens), split the trades by how many of the previous 4 sessions were also surprises: 0, 1, 2, or 3 or 4. For each group plot cumulative P&L and report trades, total P&L, average trade, Sharpe and max drawdown.
Earlier surprises (last 4 sessions)TradesP&LSharpeMax drawdown051+$5,6291.38−$1,2021127+$3,8250.69−$2,1312132+$1,5520.21−$3,8273 or 439+$1,903––
An isolated surprise is the strongest setup in this comparison. But more prior surprises don't produce a clean ranking: the two-surprise group is the weakest, while the three-or-four group remains profitable.
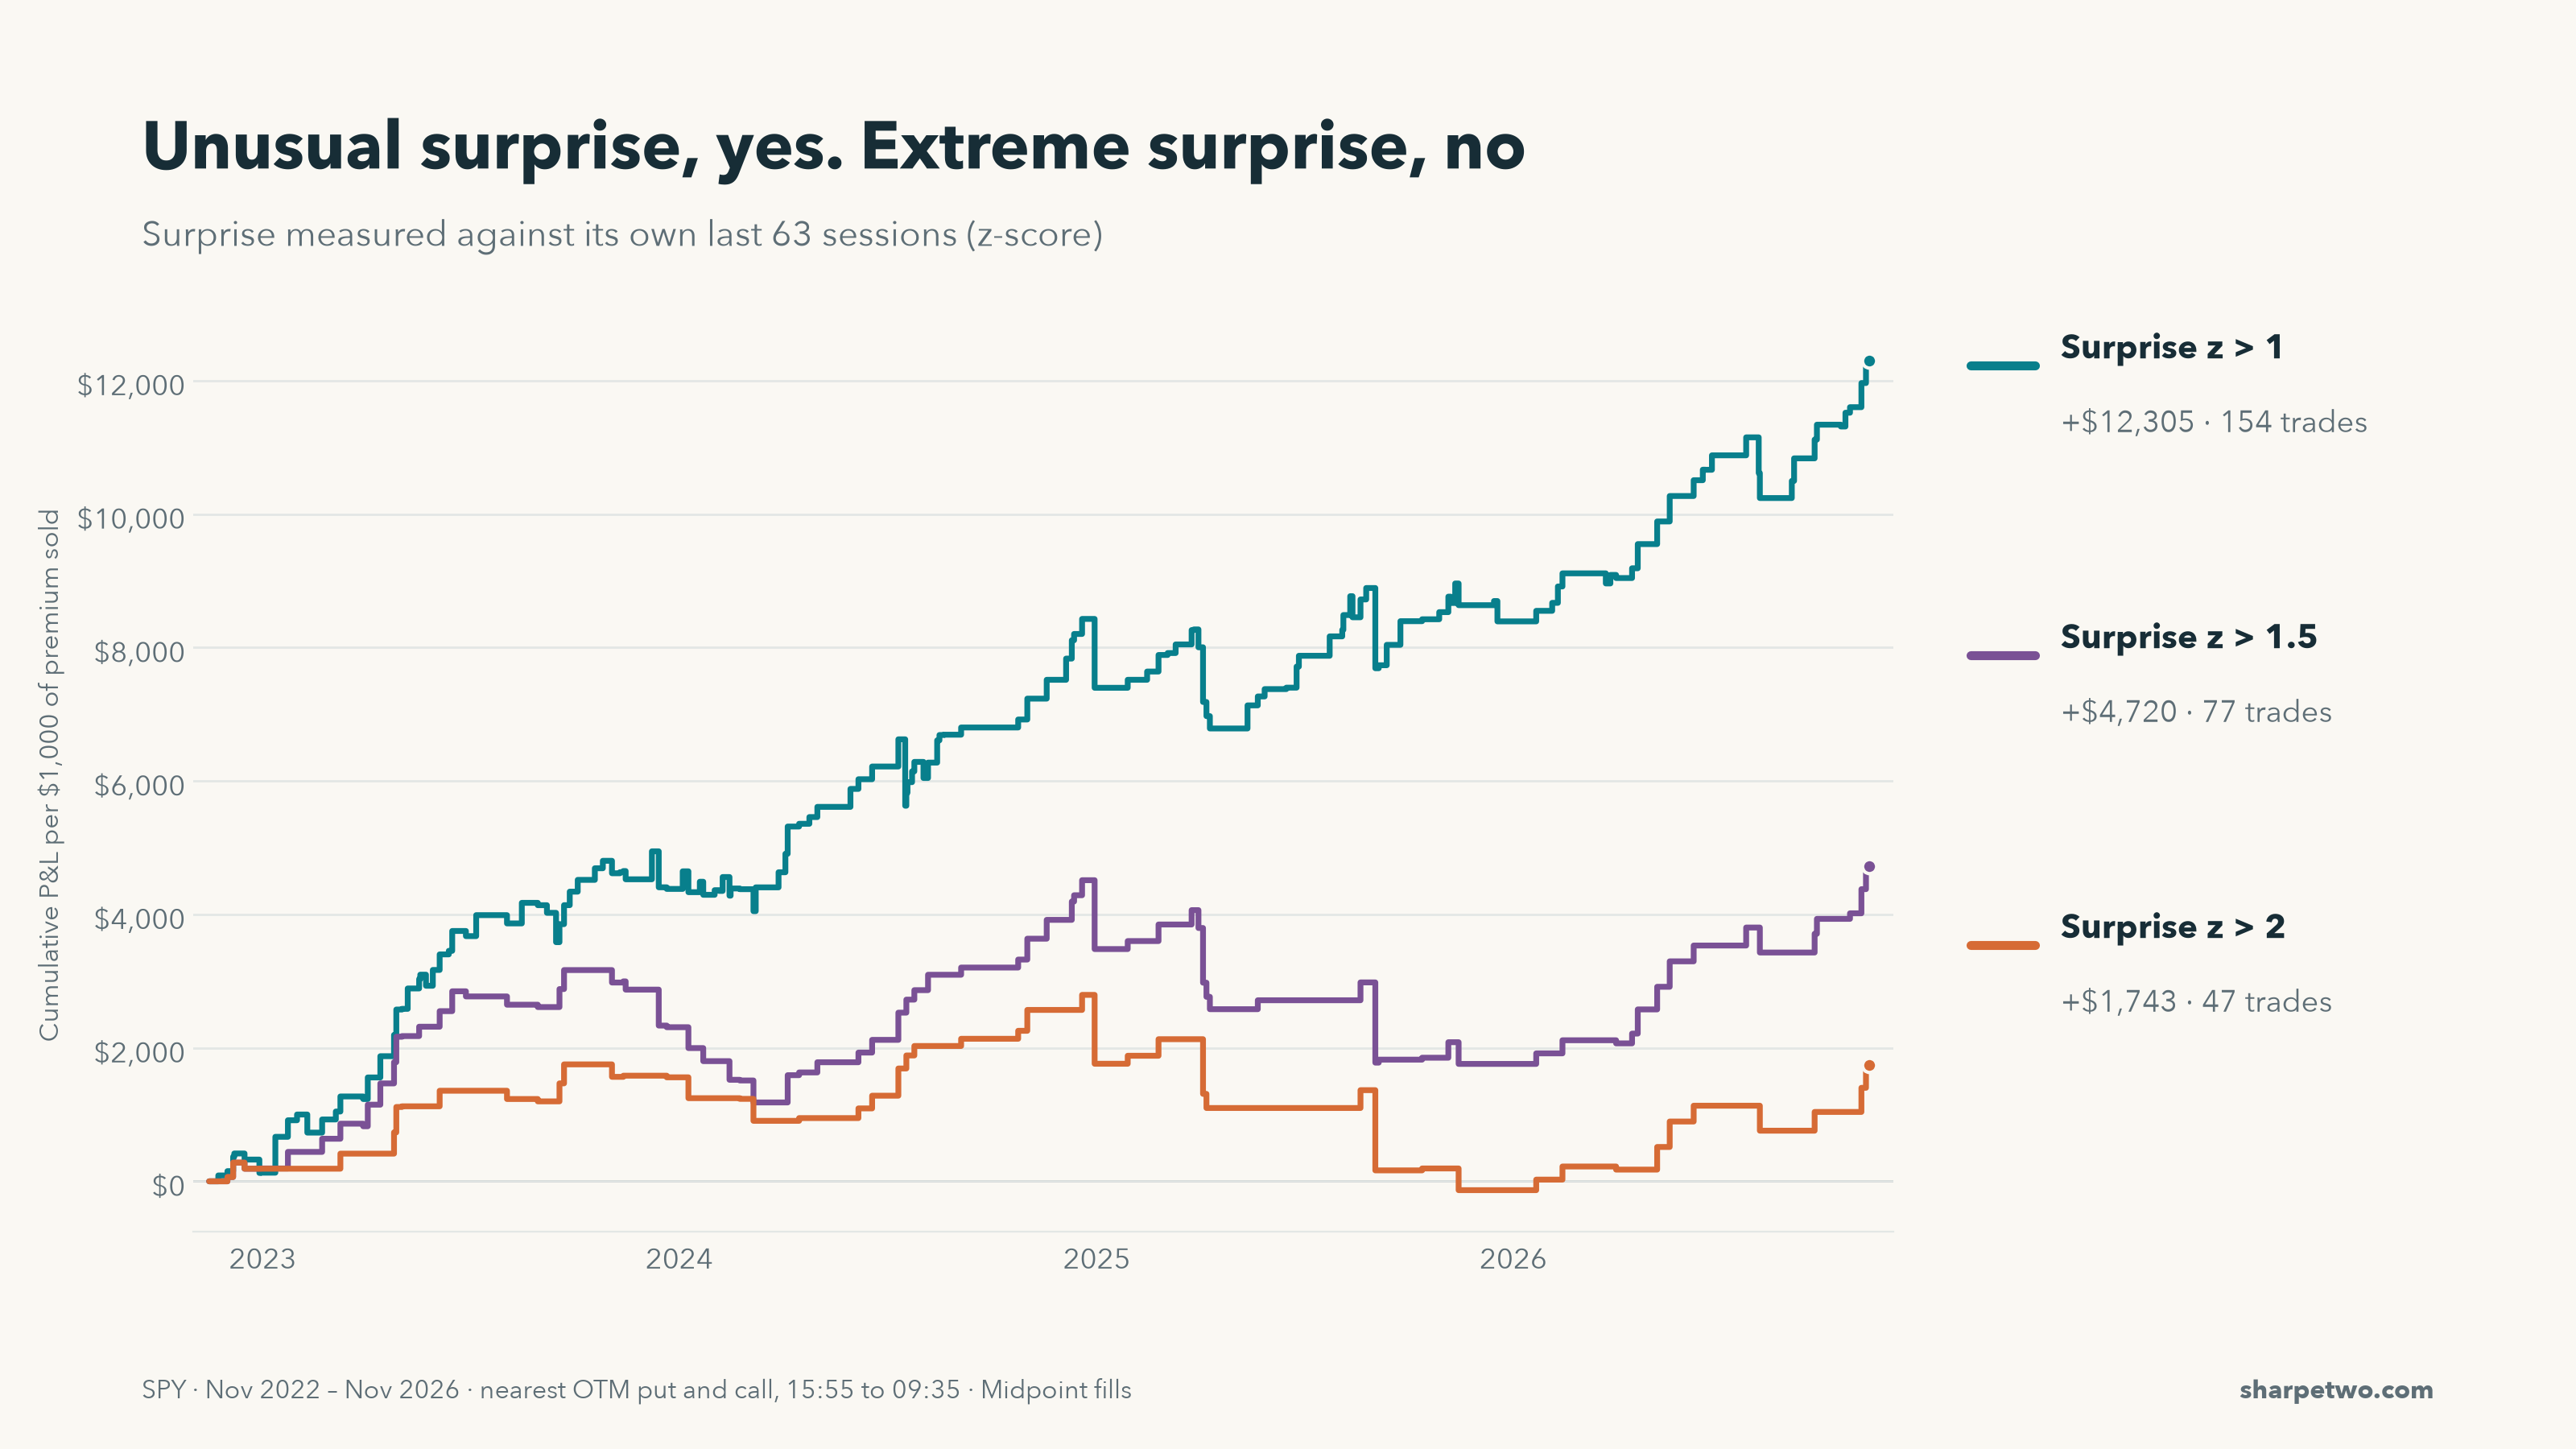
Is today's surprise unusual for the current regime? A 1.5x surprise means something different in a calm month than in a wild one. So we z-score the surprise against its own last 63 sessions and only sell when it stands out.
Prompt
Same trade and period. Z-score the surprise ratio against the previous 63 sessions (excluding today, sample standard deviation). Compare selling only when z > 1, z > 1.5 and z > 2. Plot cumulative P&L and trade counts.
z > 1 works well. Raising the threshold doesn't improve the results here: z > 2 has the fewest trades and the weakest curve.
Now pay the spread
So far every trade filled at the midpoint. Real fills don't. From here on we sell at the bid and buy back at the ask, so we don't fool ourselves with midpoint fills.
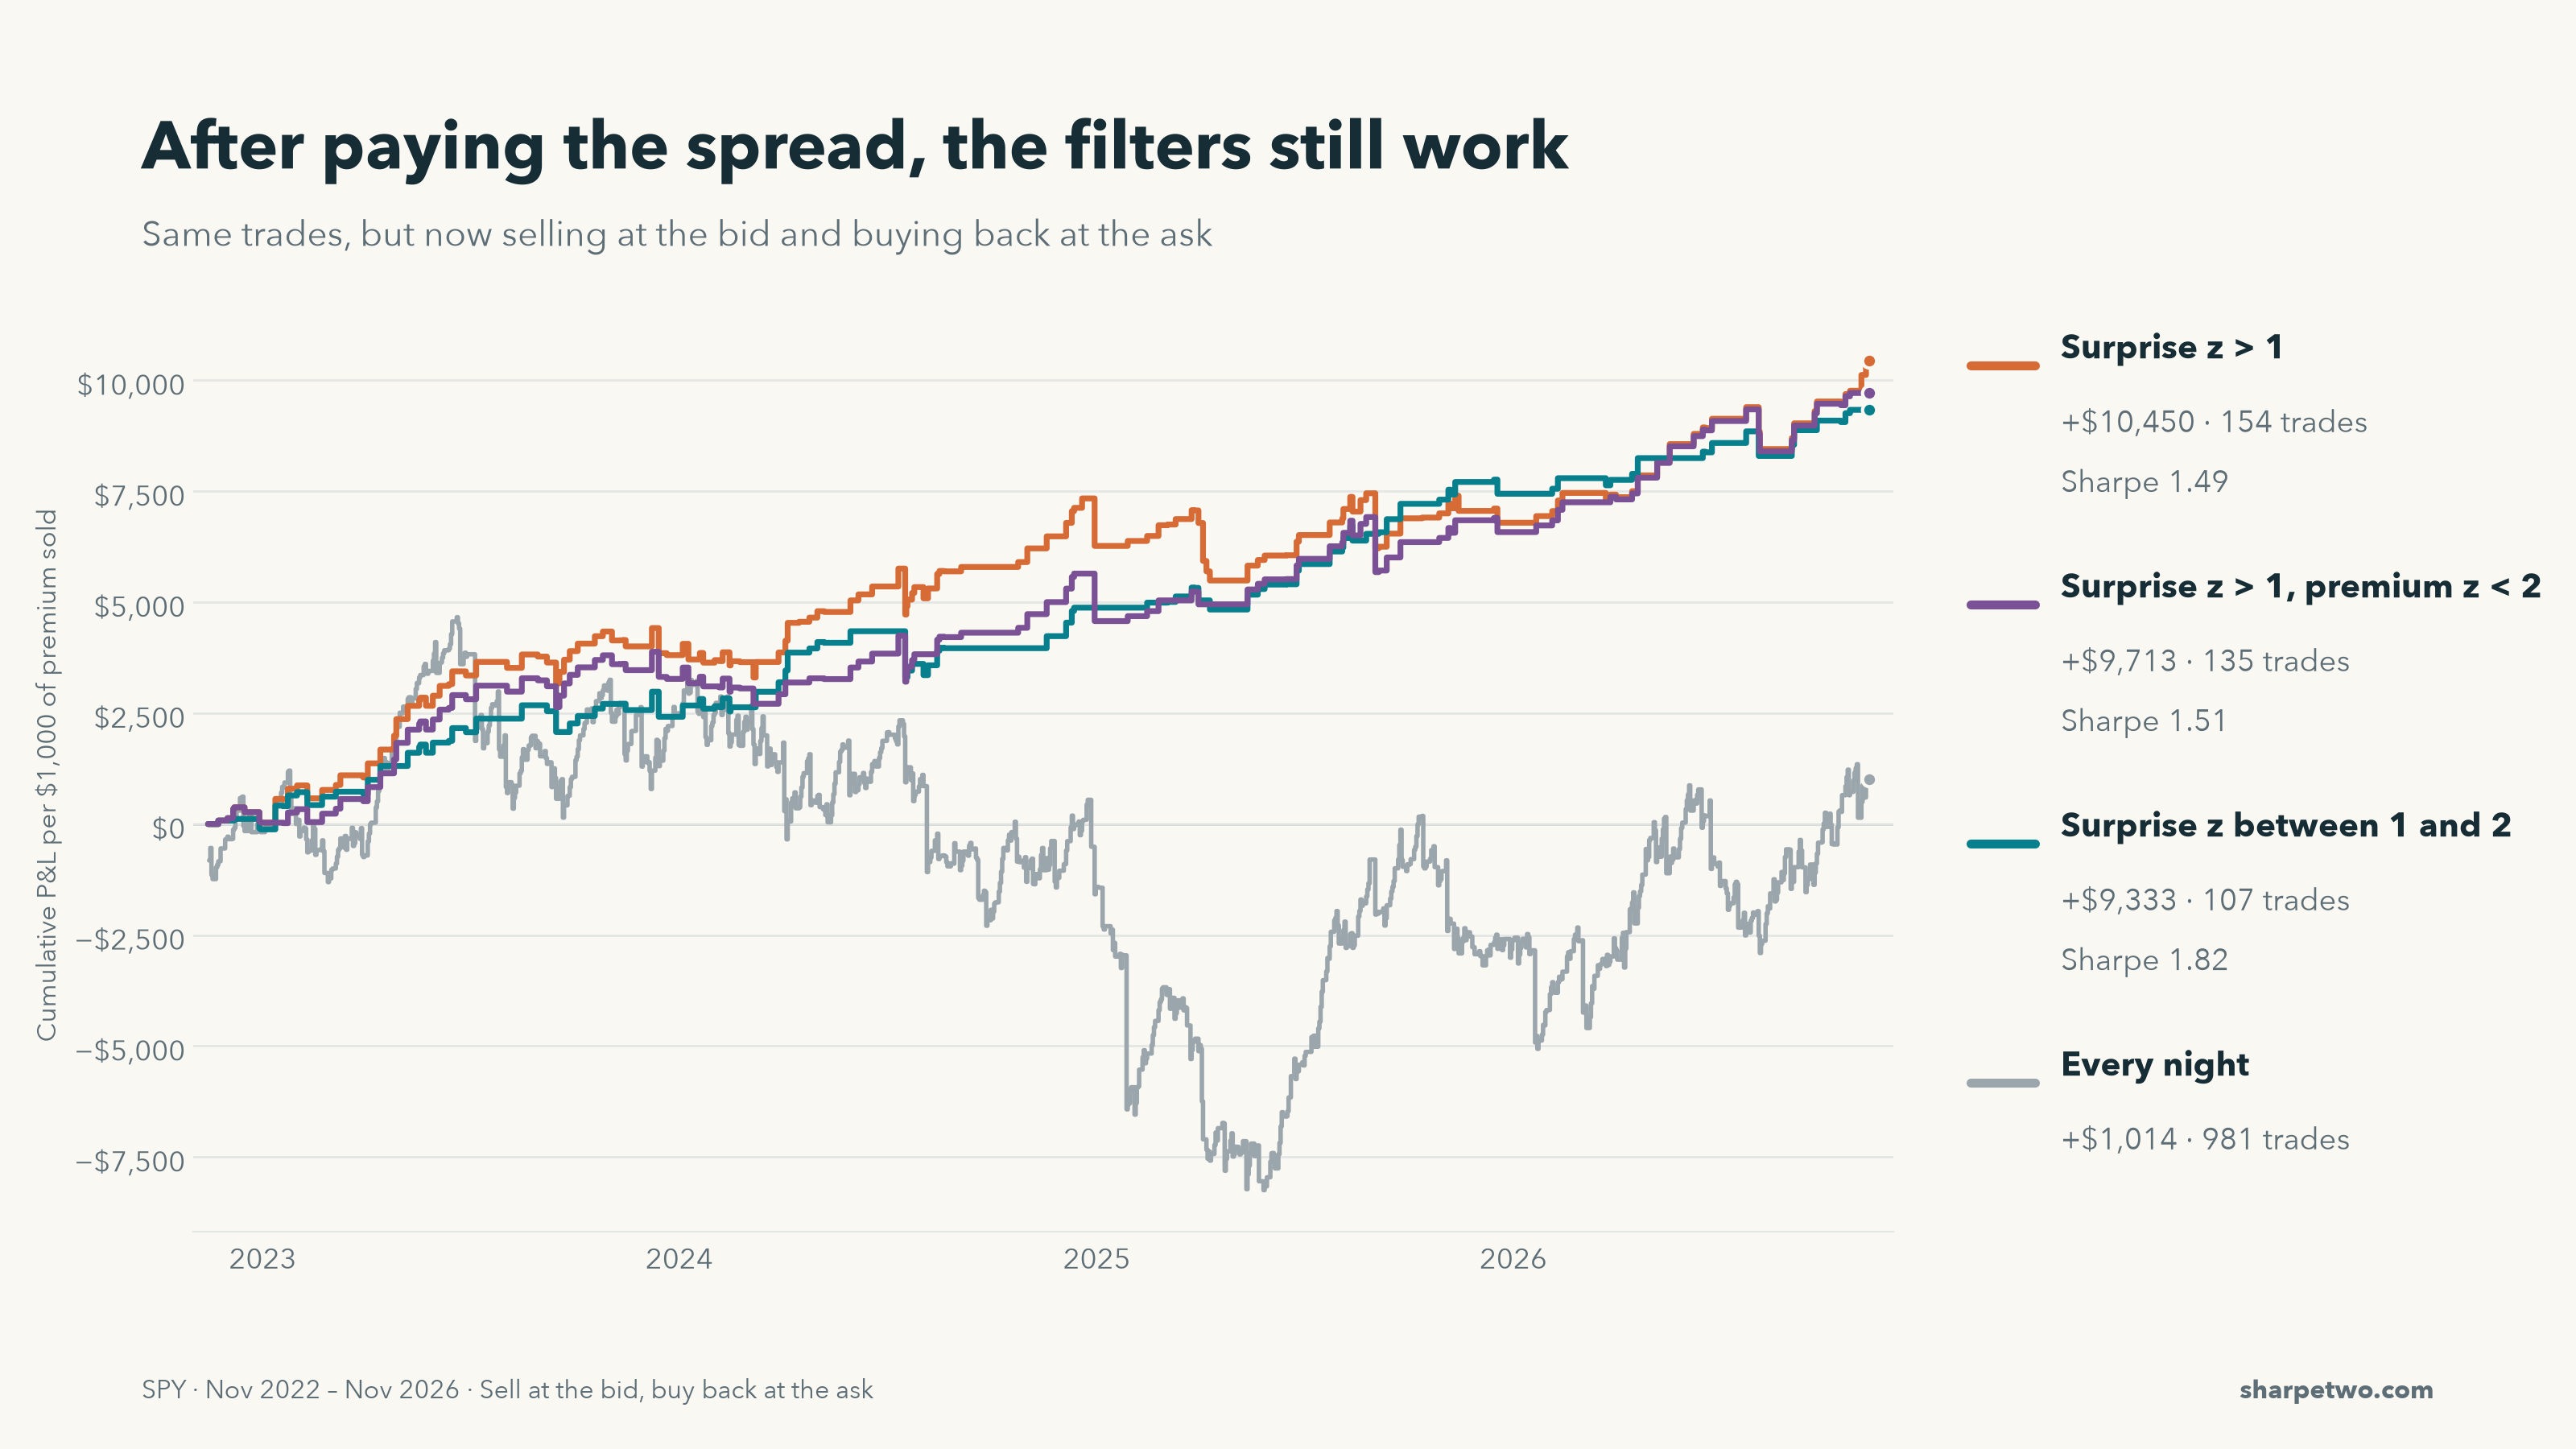
That alone changes the picture for the naive version. Selling every night made $13,466 at the midpoint. At bid/ask it makes $1,014 over 981 trades, after sitting $8,000 underwater in spring 2025. The spread eats almost everything. A filter isn't a nice-to-have here, it's the whole strategy.
Since a big surprise can mean real turmoil, what if we only trade moderate surprises? Two ways to define that:
-
surprise z between 1 and 2, or
-
surprise z above 1, but skip nights when the premium itself is unusually high (premium z above 2).
Prompt
Same trade and period, but sell at the bid and buy back at the ask, sized to $1,000 of bid credit. Compare: (A) surprise z > 1, (B) 1 < surprise z < 2, (C) surprise z > 1 and premium z < 2, where premium z is today's combined midpoint premium z-scored against the previous 63 sessions, excluding today and using sample standard deviation. Include the full every-night bid/ask curve as a reference. Plot cumulative P&L and report trades and Sharpe (daily, idle days at zero, annualised with √365.25).
All three survive the spread, and the two moderate versions are smoother. The moderate one (z between 1 and 2) has the best Sharpe, 1.82.
The weak spot is the parameters. Why 1 and 2? Why not 1.5 and 2.5? That matters more than it looks. During a drawdown, we may find ourselves questioning those boundaries much more than we would a decision anchored in a forecast.
At Sharpe Two, we prefer prediction-led approaches to choosing fixed thresholds. Here, however, we have a small trade sample; fitting another model to it would carry a substantial risk of overfitting.
There is another approach we can use: combine the threshold-based signals with an existing forecast.
Let the signals vote
Instead of betting everything on one way of looking at the problem, ask several and only trade when they agree. The question stops being "did I pick the right threshold?" and becomes "do enough different views say yes?"
We use three signals:
-
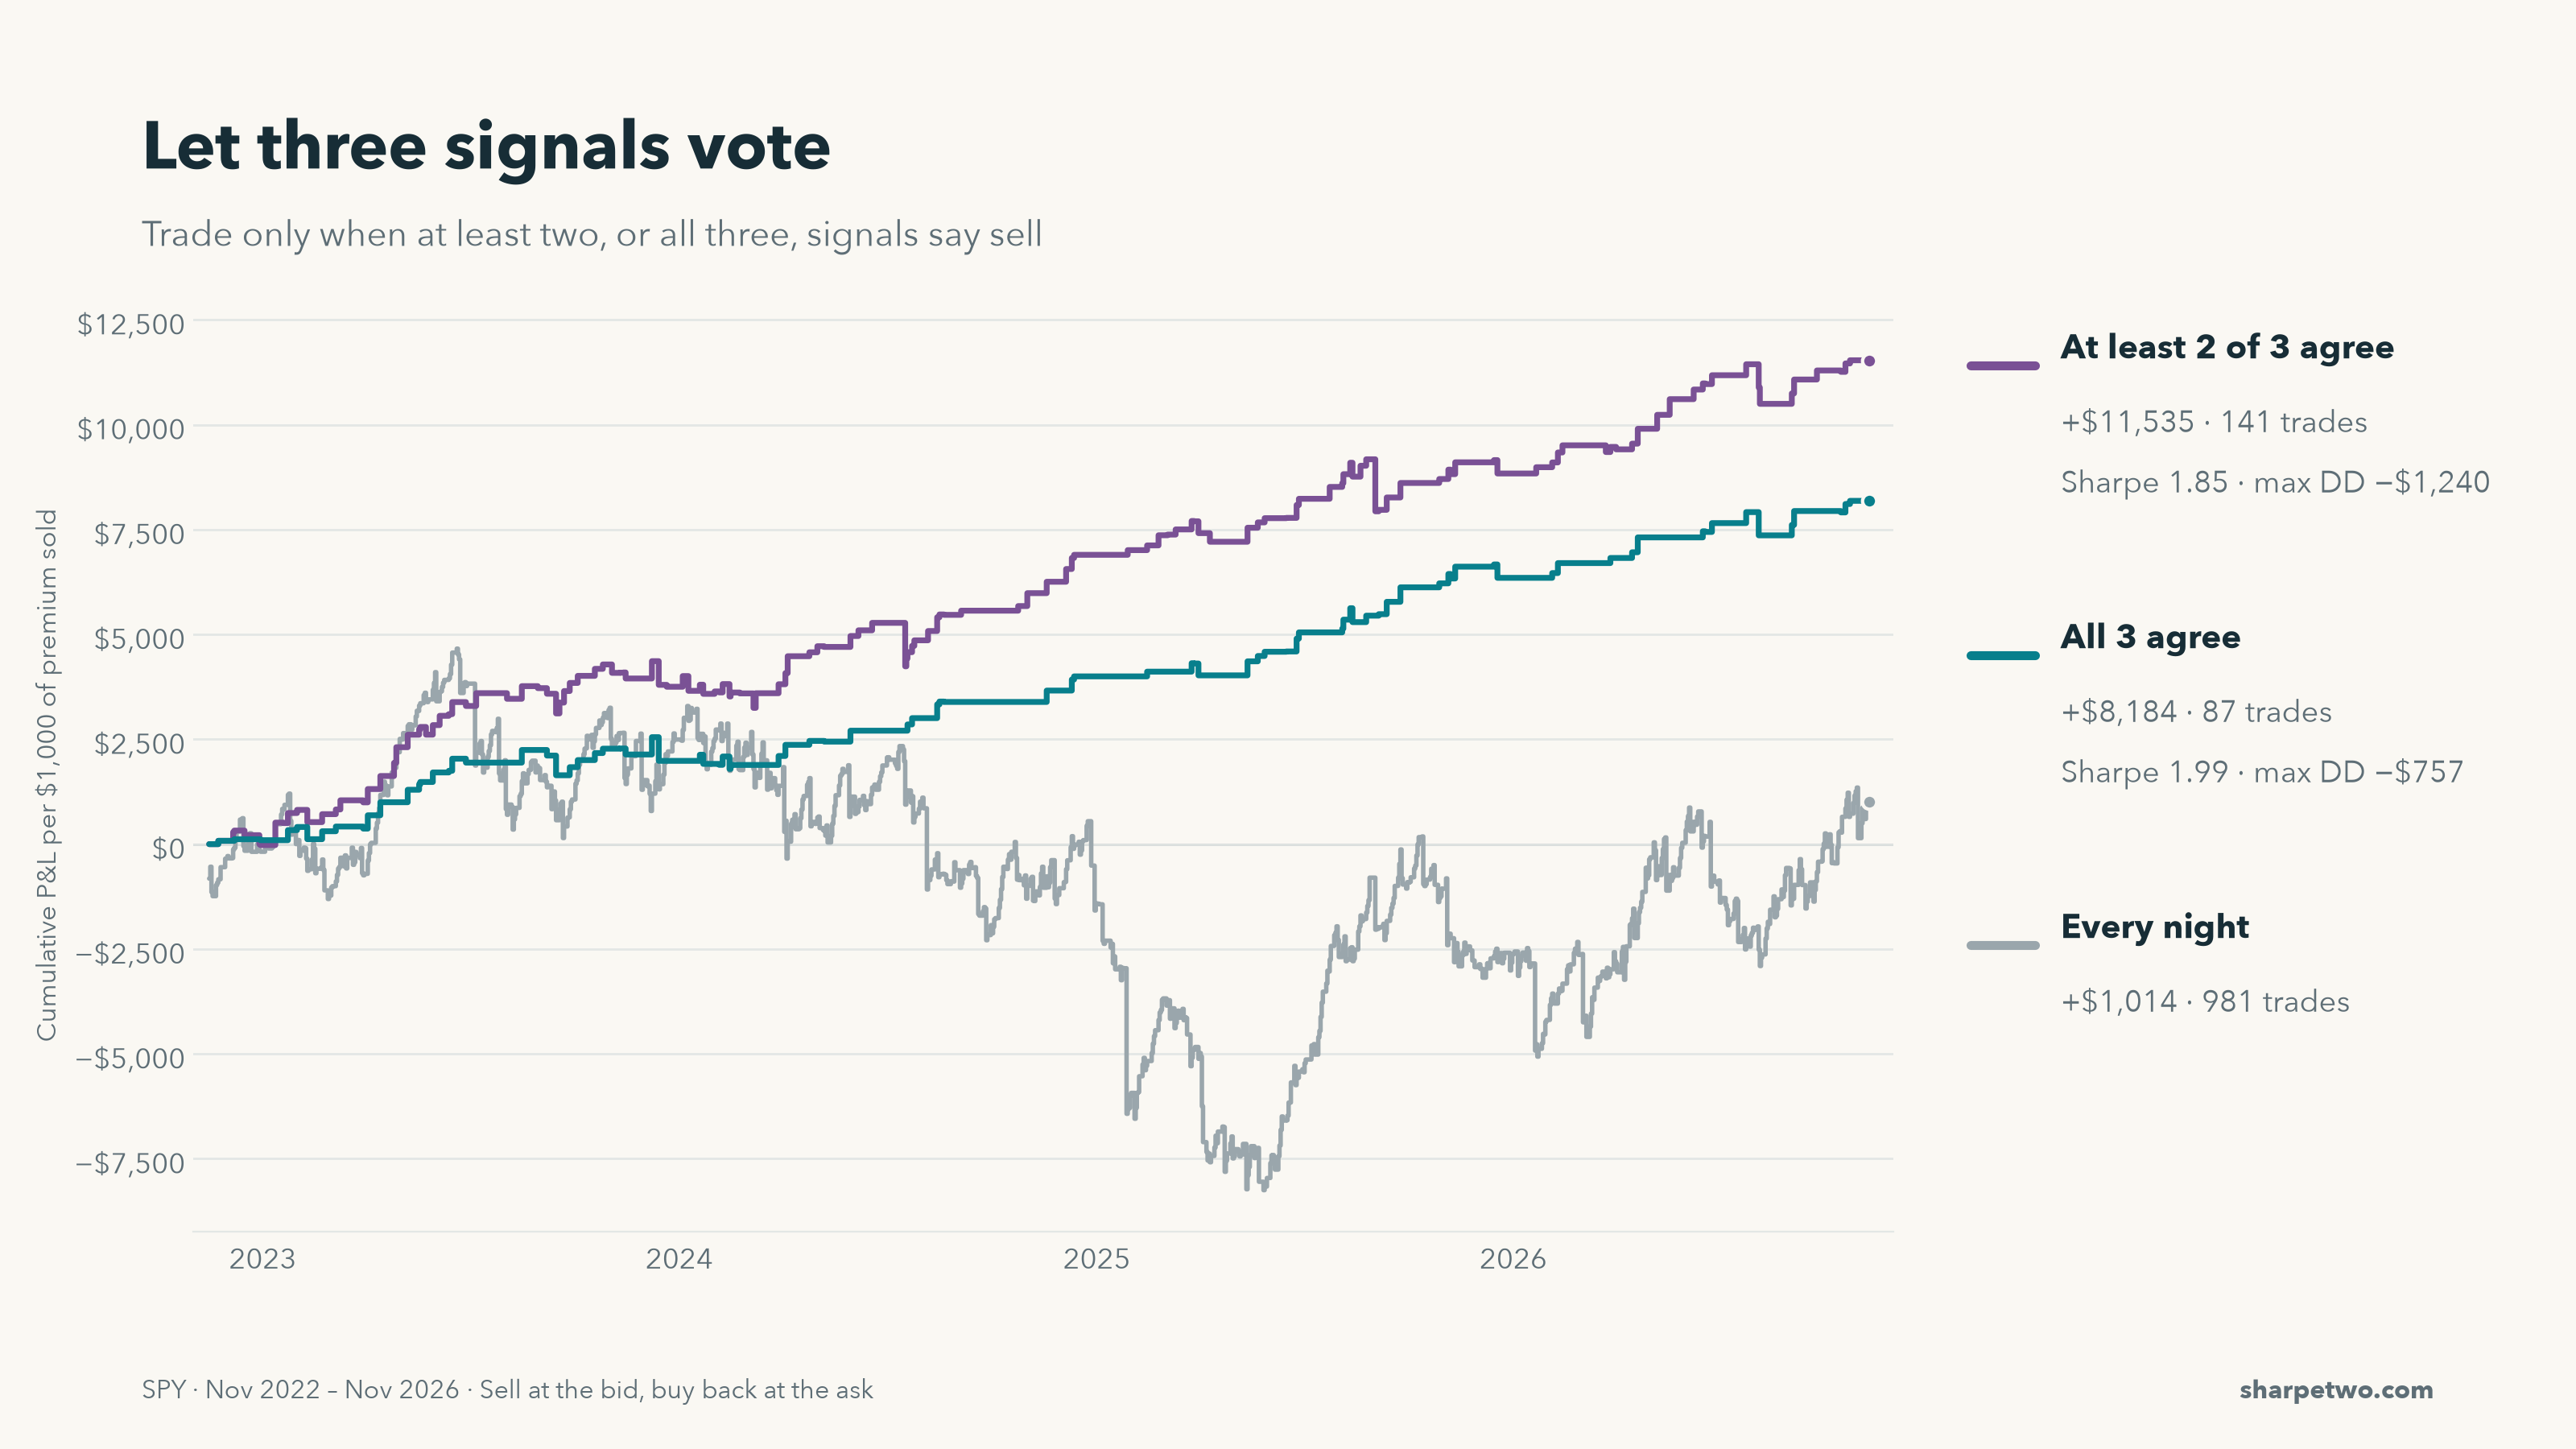
A: moderate surprise (1 < surprise z < 2)
-
B: surprise without an expensive premium (surprise z > 1 and premium z < 2)
-
C: Nightcall, our own overnight signal. It's built on the same idea as the clustering chart above: how much surprise the market has absorbed over the past week. But instead of a simple count, it uses a formula that weighs those surprises to judge whether tonight is a good night to be the insurer.
A and B you can build yourself from the prompts above. For C, we use Sharpe Two's historical Nightcall short-entry signals.
Prompt
Same trade and period, bid/ask fills. Define A as 1 < surprise z < 2, B as surprise z > 1 with premium z < 2, and C as the historical Sharpe Two Nightcall short-entry flags supplied alongside the quote data. Compare trading when all three agree with trading when at least two agree. A signal that can't be computed abstains. Use common quote eligibility and unknown-outcome handling within the voting comparisons. Include the full every-night bid/ask curve as a reference. Plot cumulative P&L and report trades, Sharpe and max drawdown.
When all three agree, the strategy reaches a Sharpe of about 2 with a $757 max drawdown, the best of anything in this post, after paying the spread. Two out of three trades more often and makes more money (+$11,535 over 141 trades) with a Sharpe of 1.85. Compare that with the grey line: same trade, same spread, no filter.
What we'd do next
This is a demonstration, not a finished strategy. Before trading it we'd run a proper walk-forward test: fit on one period, test on the next, roll forward, and check the results hold up section by section. We'd also size it with the tail in mind. Short options overnight will, sooner or later, meet a gap.
But notice how this was built. One question at a time, each answered with a plain-English prompt, each answer suggesting the next question. Claude handles the data work and calculations while we choose the hypothesis, question the parameters and decide what is worth pursuing. That is the division of work we describe in five tasks to delegate to an AI options trading agent.
Try it yourself
Every prompt above runs on Sharpe Two data. You can:
-
Rebuild the quote-based tests from our SPY options dataset and change anything you like: the entry time, the exit time, the thresholds, the underlying.
-
Bring Sharpe Two into your workflow. Explore our API documentation and agentic platform to see how our data and analytics fit your research.
-
Talk it through with other traders in our subscriber Discord. See Sharpe Two plans, or sign in and open Discord from the sidebar if you're already a subscriber.
Start with the first prompt and see where your questions take you.
Discussion
0 COMMENTSLog in to join the discussion.